Scatter plot 4
Category: scatter
library(tidyverse)
data(iris)
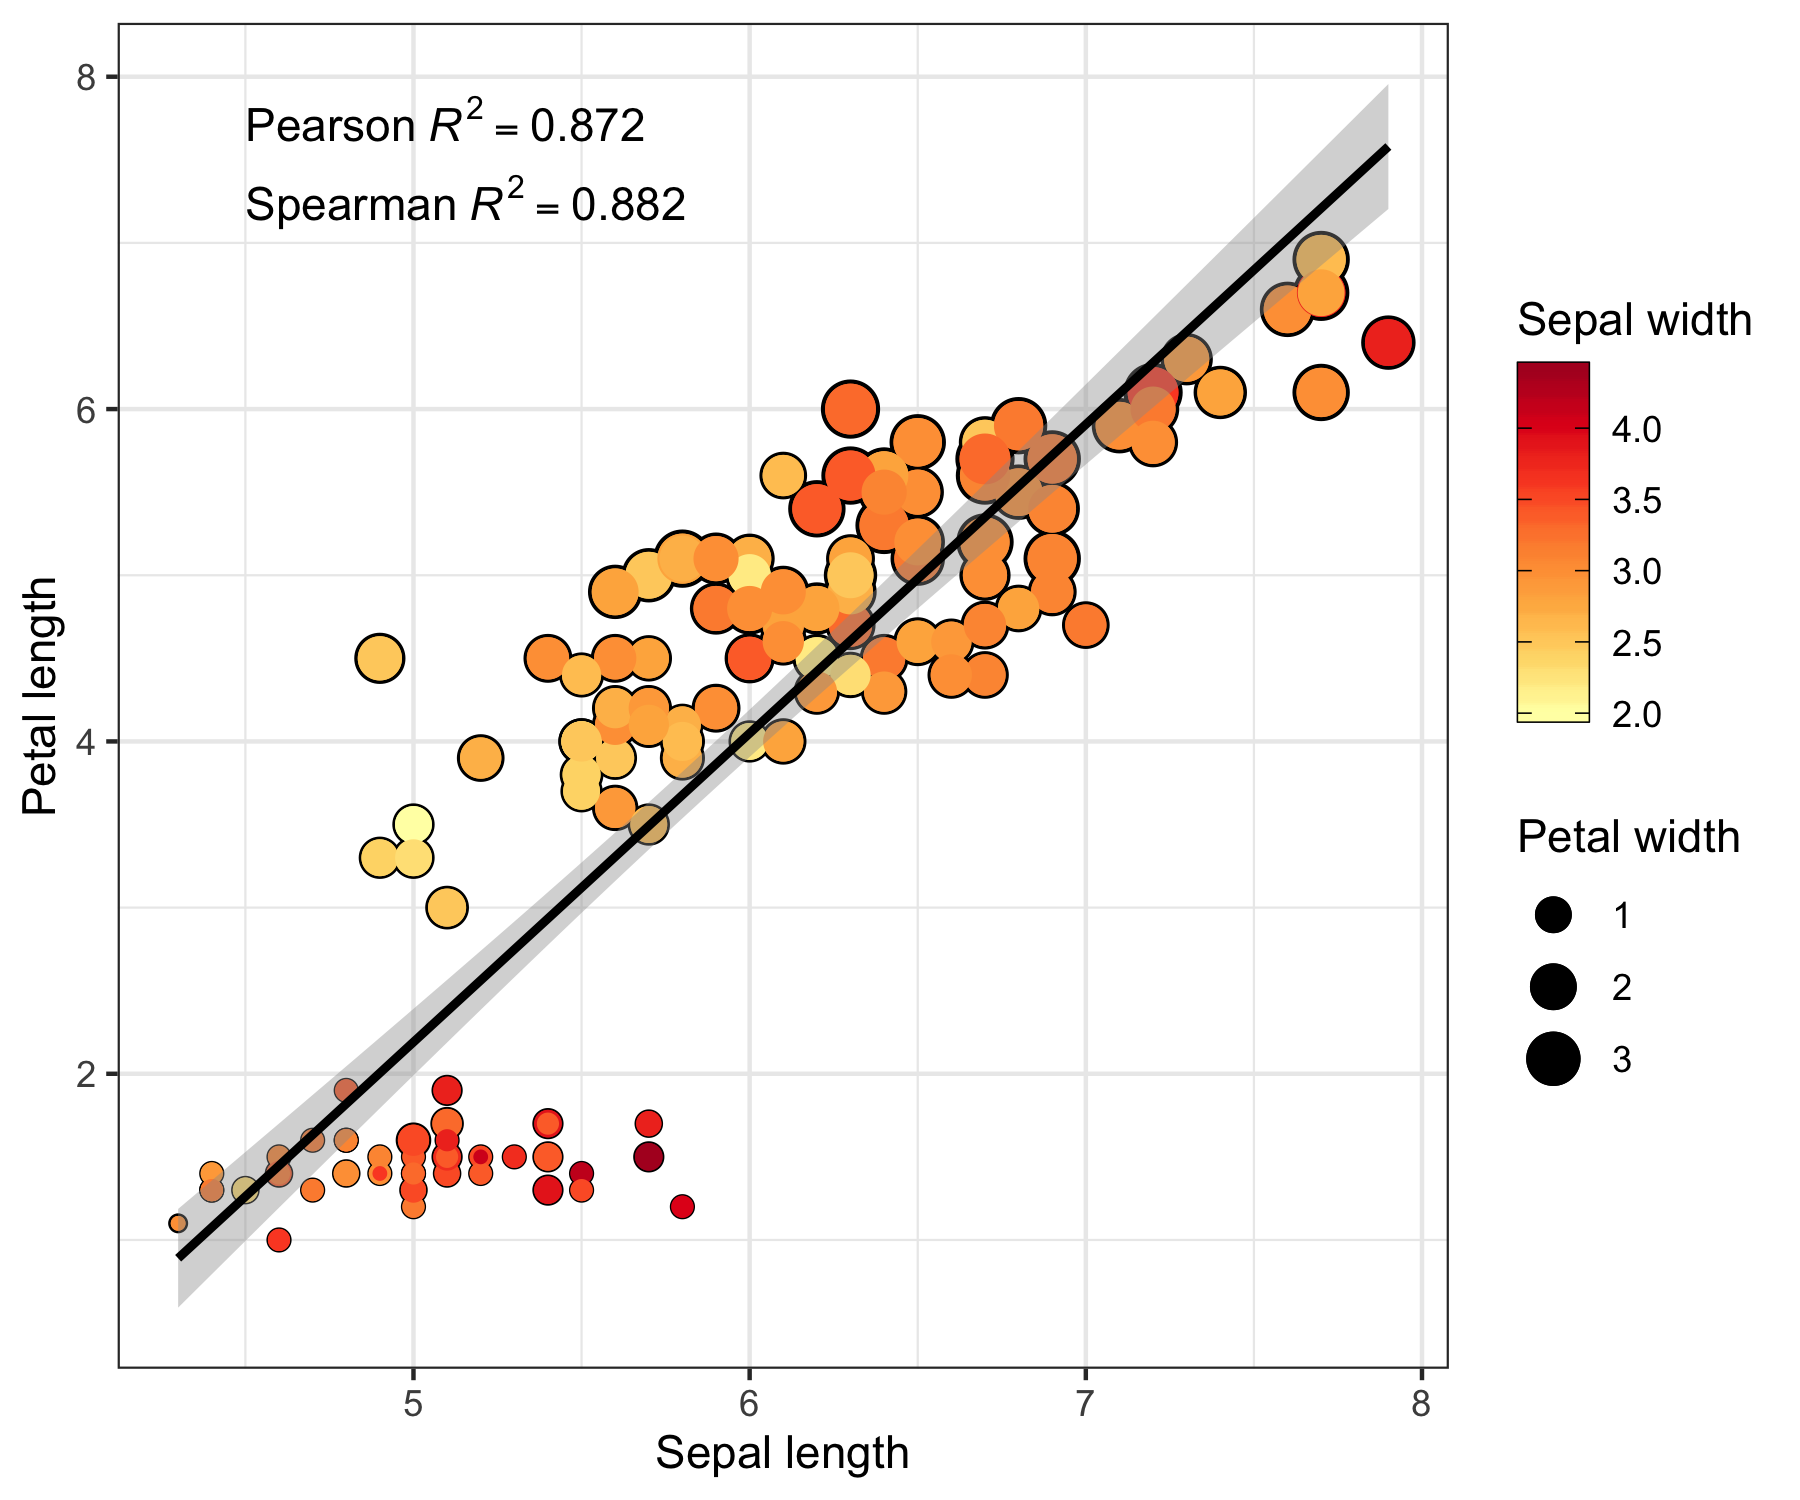
correlation_pearson <- cor(iris$Sepal.Length, iris$Petal.Length, method = 'pearson')
correlation_spearman <- cor(iris$Sepal.Length, iris$Petal.Length, method = 'spearman')
label <- list(
paste0('Pearson~italic(R)^2 == ', round(correlation_pearson, 3)),
paste0('Spearman~italic(R)^2 == ', round(correlation_spearman, 3))
)
p <- iris %>%
mutate(Petal.Width.larger = Petal.Width * 1.5) %>%
ggplot(aes(Sepal.Length, Petal.Length, color = Sepal.Width, size = Petal.Width)) +
geom_point(aes(size = Petal.Width.larger), color = 'black', show.legend = FALSE) +
geom_point() +
geom_point() +
geom_smooth(method = 'lm', formula = y~x, color = 'black', show.legend = FALSE) +
scale_color_distiller(
palette = 'YlOrRd', name = 'Sepal width', direction = 1,
guide = guide_colorbar(frame.colour = 'black', ticks.colour = 'black')
) +
labs(x = 'Sepal length', y = 'Petal length', size = 'Petal width') +
theme_bw() +
annotate('text', x = 4.5, y = c(7.75, 7.25), hjust = 0, parse = TRUE, label = label)
ggsave('4.png', p, height = 5, width = 6)