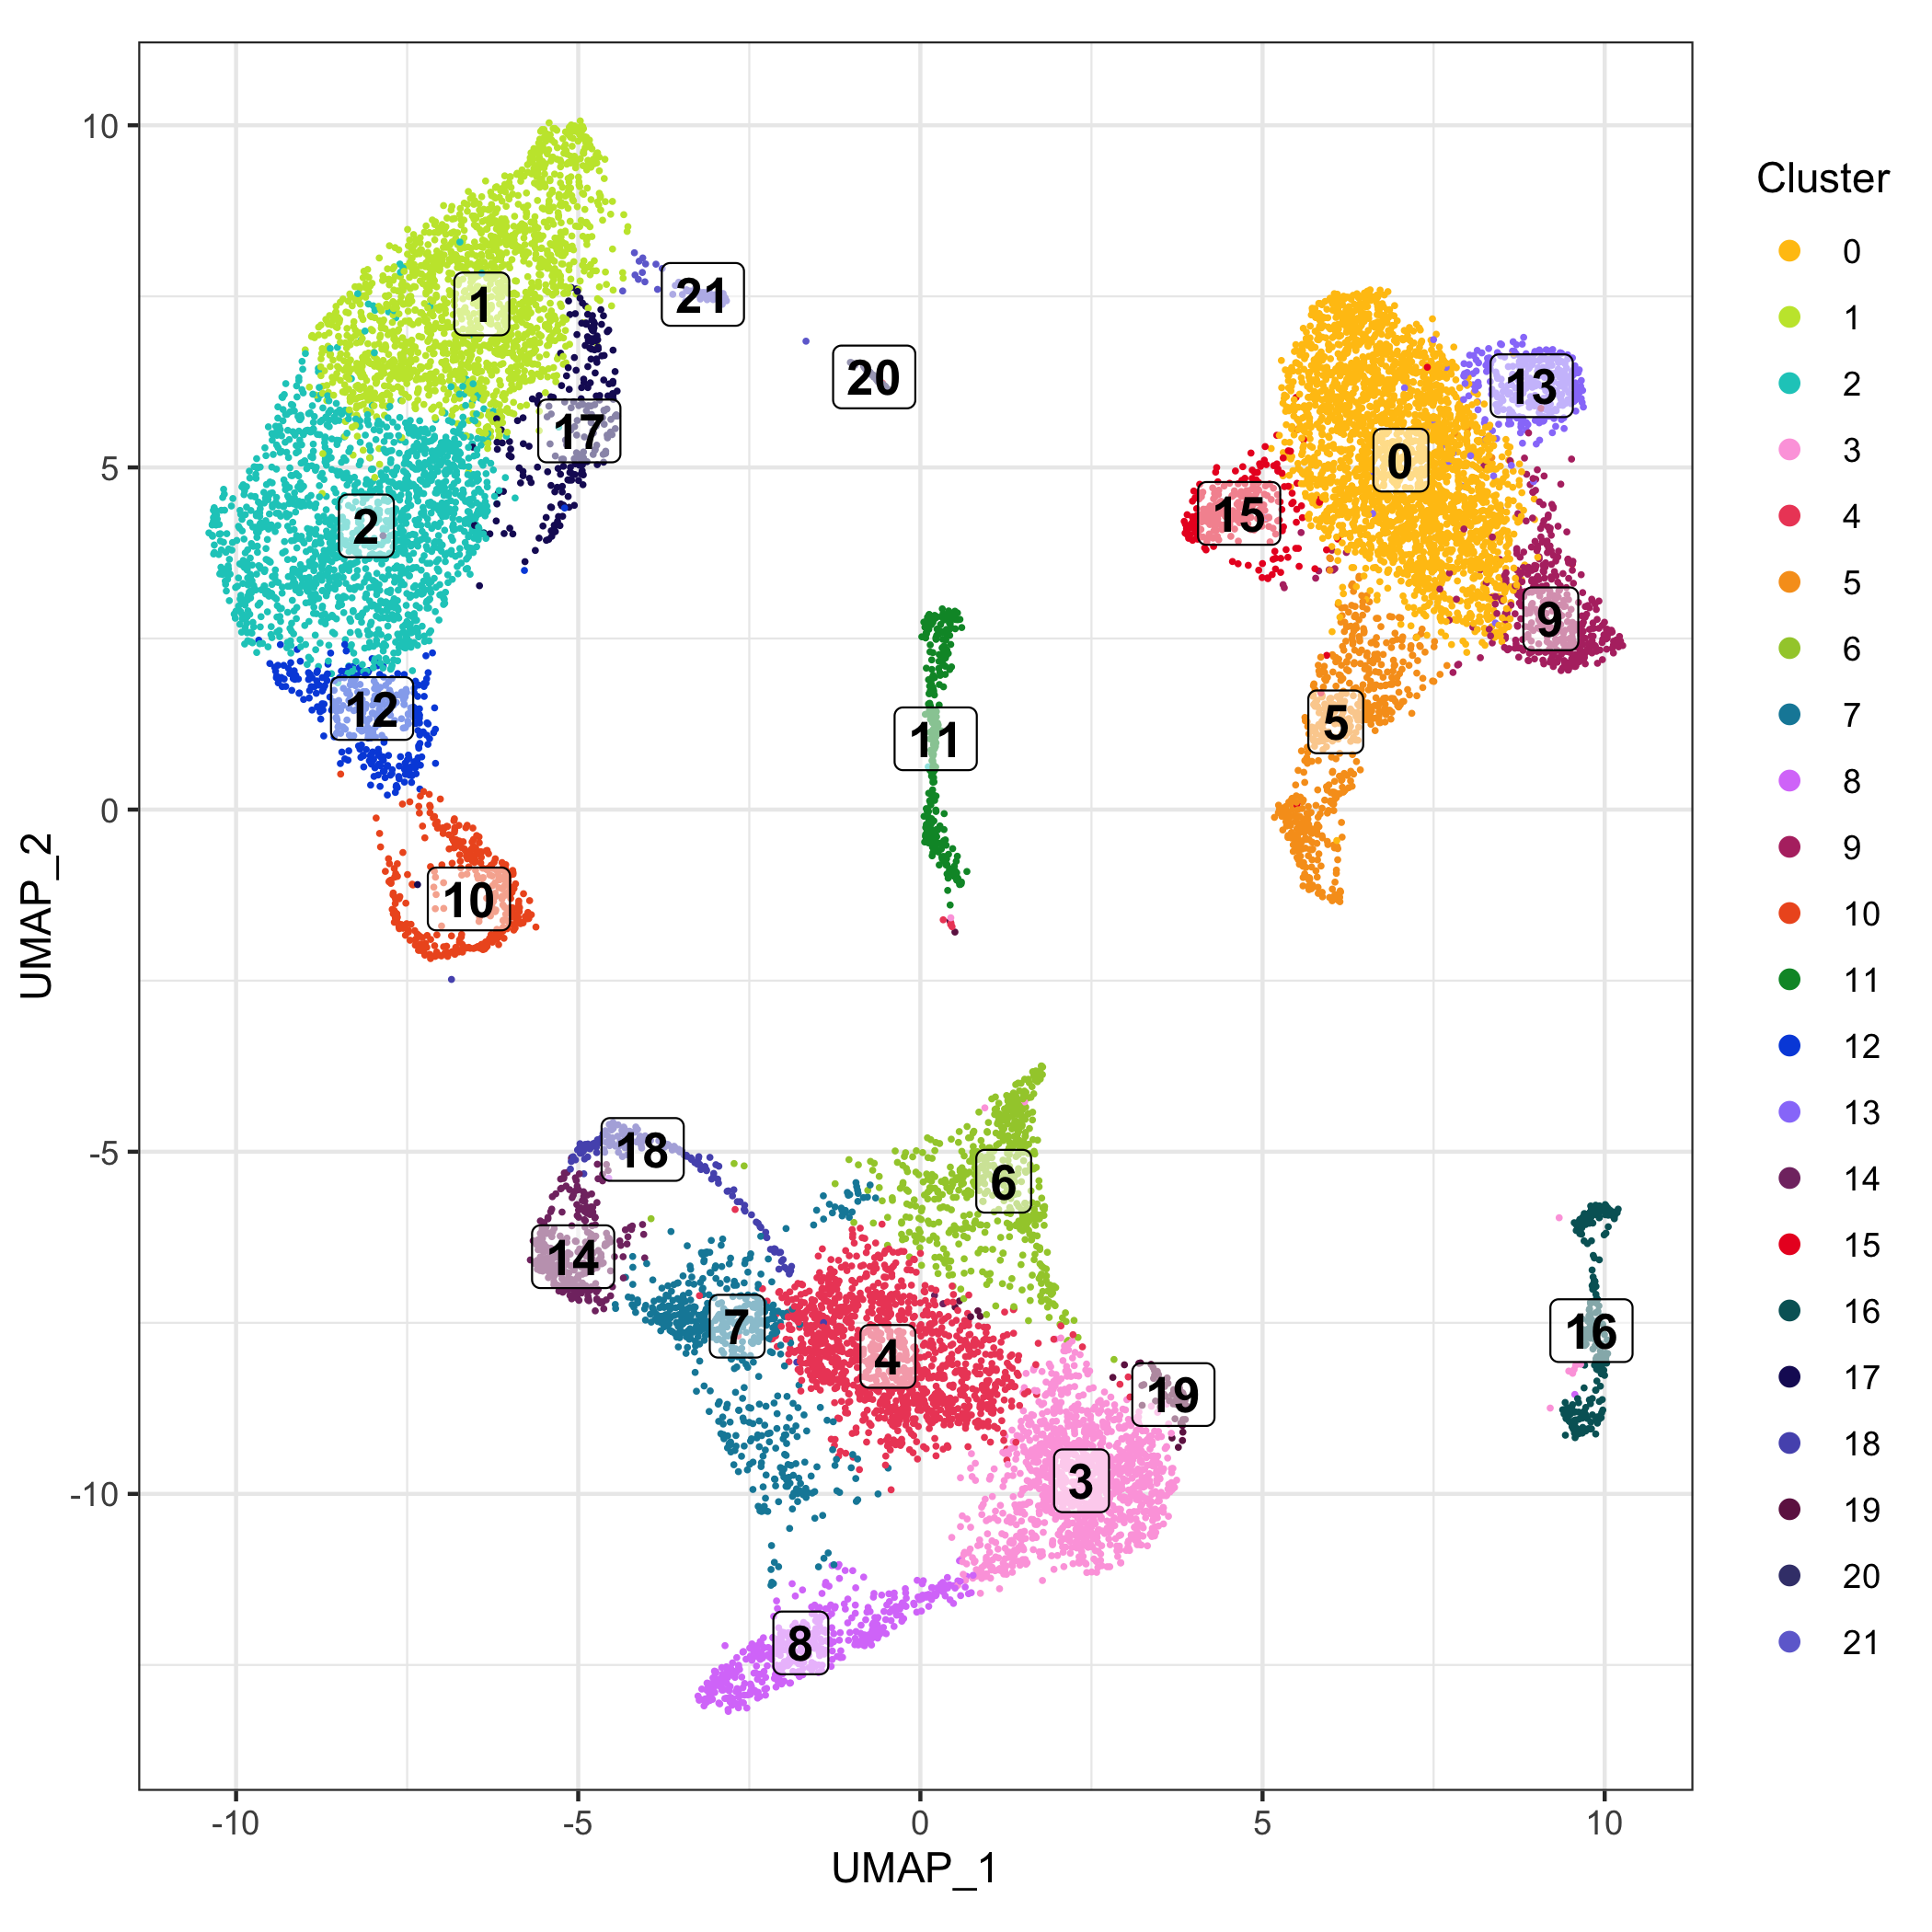
Scatter plot 3
Category: scatter
library(tidyverse)
library(Seurat)

# create color palette from flatuicolors.com
colors_dutch <- c(
  '#FFC312','#C4E538','#12CBC4','#FDA7DF','#ED4C67',
  '#F79F1F','#A3CB38','#1289A7','#D980FA','#B53471',
  '#EE5A24','#009432','#0652DD','#9980FA','#833471',
  '#EA2027','#006266','#1B1464','#5758BB','#6F1E51'
)
colors_spanish <- c(
  '#40407a','#706fd3','#f7f1e3','#34ace0','#33d9b2',
  '#2c2c54','#474787','#aaa69d','#227093','#218c74',
  '#ff5252','#ff793f','#d1ccc0','#ffb142','#ffda79',
  '#b33939','#cd6133','#84817a','#cc8e35','#ccae62'
)
custom_colors <- c(colors_dutch, colors_spanish)

# load a single cell expression data set (generated in the lab I work at)
seurat <- readRDS('seurat.rds')

# calculate center position for each cluster
UMAP_centers_cluster <- tibble(
    UMAP_1 = as.data.frame(seurat@reductions$UMAP@cell.embeddings)$UMAP_1,
    UMAP_2 = as.data.frame(seurat@reductions$UMAP@cell.embeddings)$UMAP_2,
    cluster = seurat@meta.data$seurat_clusters
  ) %>%
  group_by(cluster) %>%
  summarize(x = median(UMAP_1), y = median(UMAP_2))

# plot
p <- bind_cols(seurat@meta.data, as.data.frame(seurat@reductions$UMAP@cell.embeddings)) %>%
  ggplot(aes(UMAP_1, UMAP_2, color = seurat_clusters)) +
  geom_point(size = 0.2) +
  geom_label(
    data = UMAP_centers_cluster,
    mapping = aes(x, y, label = cluster),
    size = 4.5,
    fill = 'white',
    color = 'black',
    fontface = 'bold',
    alpha = 0.5,
    show.legend = FALSE
  ) +
  theme_bw() +
  scale_color_manual(values = custom_colors) +
  labs(color = 'Cluster') +
  coord_fixed() +
  guides(colour = guide_legend(ncol = 1, override.aes = list(size = 2))) +
  theme(legend.position = 'right')
ggsave('3.png', p, height = 7, width = 7)