Scatter plot 2
Category: scatter
library(tidyverse)
library(MASS)
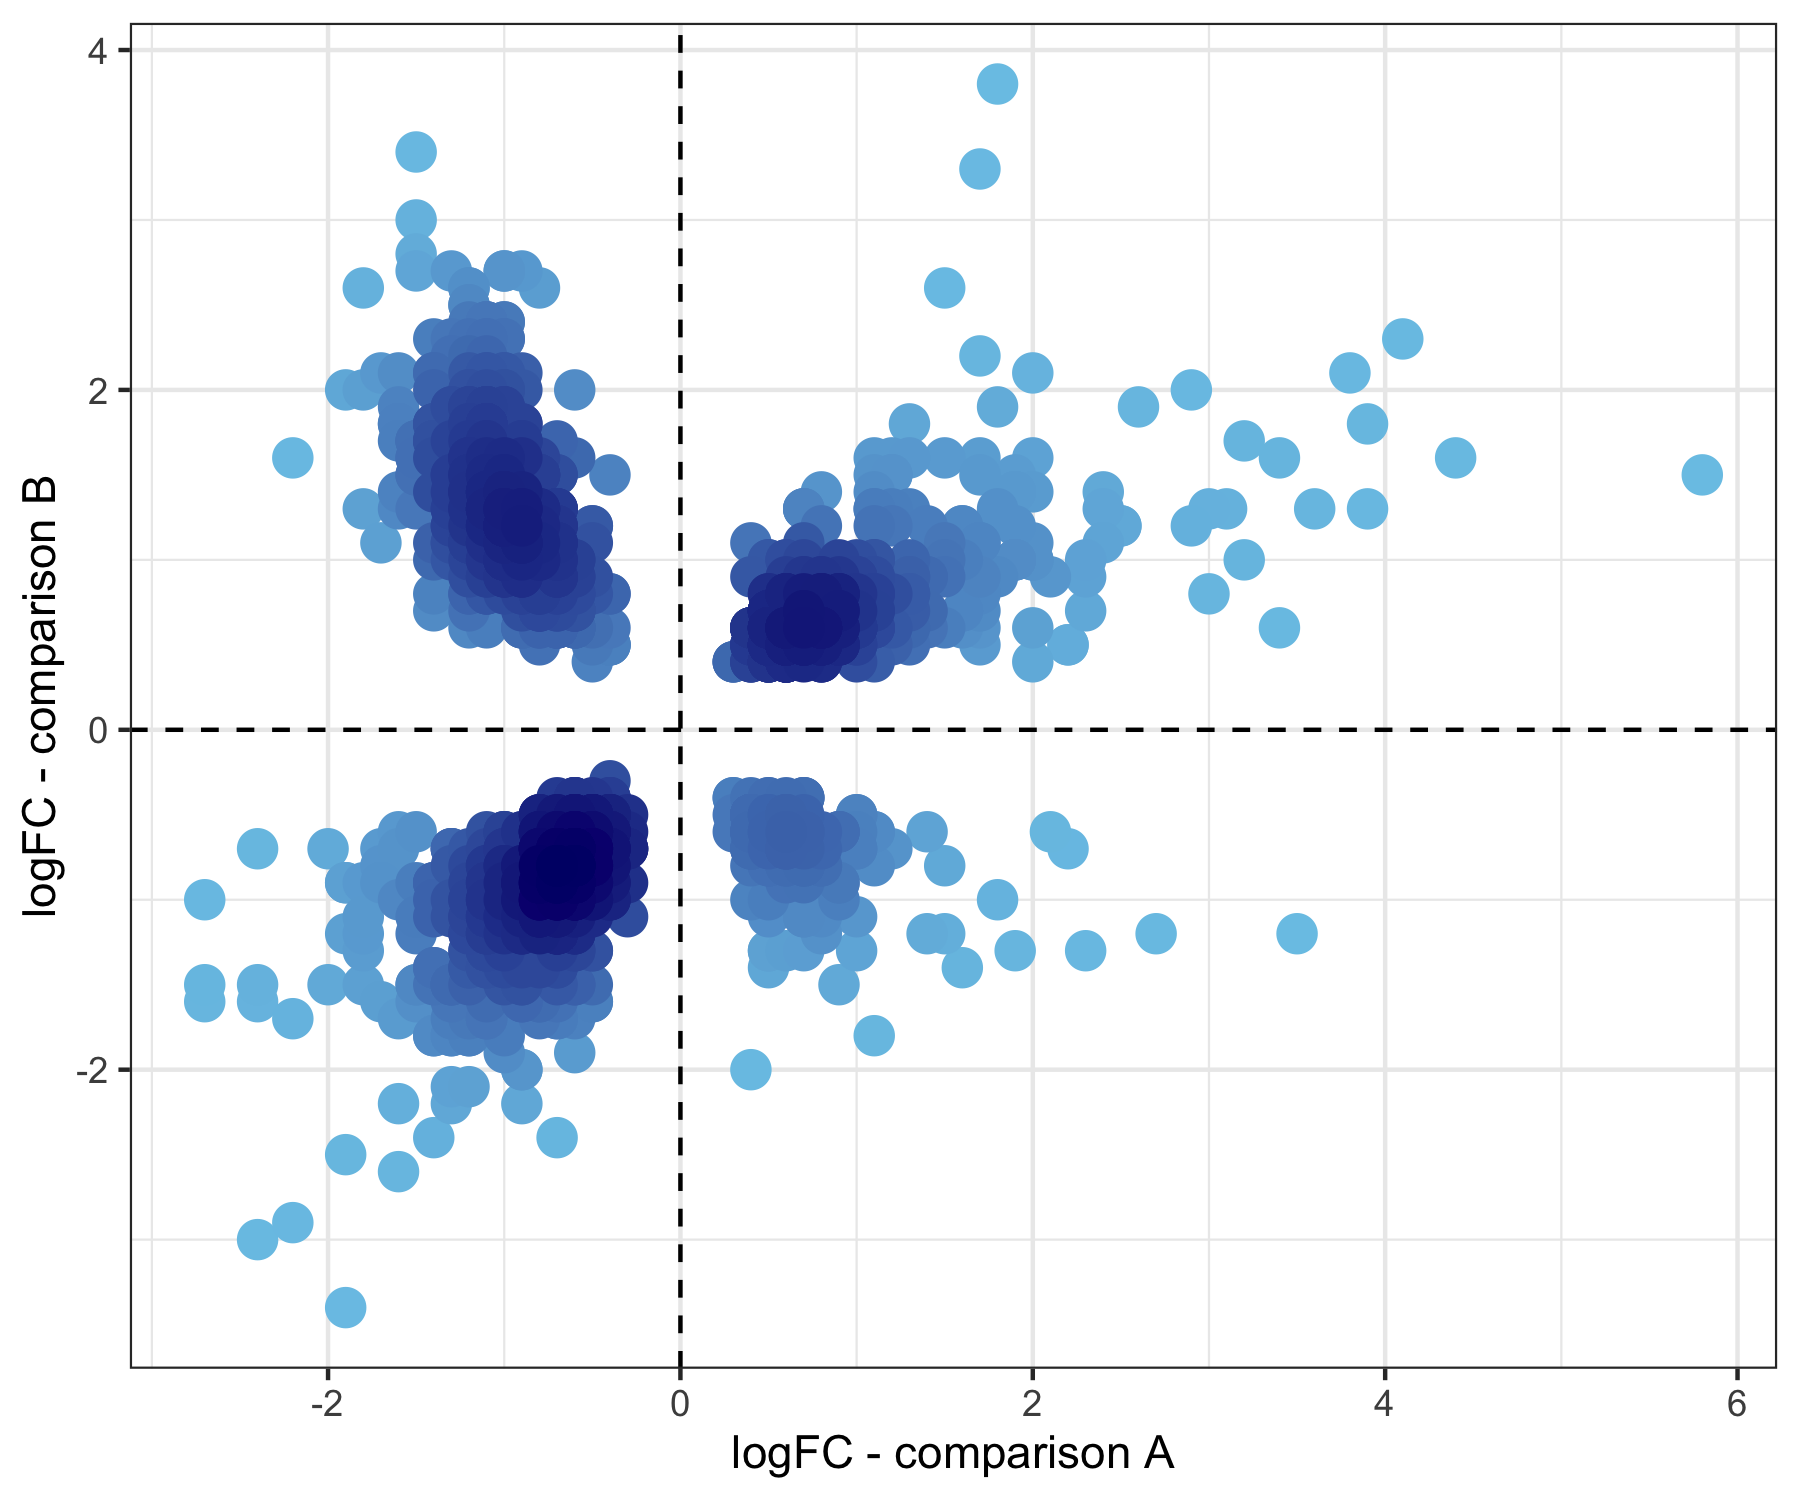
# download differential expression data from EBI Expression Atlas database
# https://www.ebi.ac.uk/gxa/experiments/E-MTAB-7445/Results
t <- read_tsv('E-MTAB-7445-query-results.tsv', skip = 3) %>%
rename(
gene_id = 1,
gene_name = 2,
comparison_1_fold_change = 3,
comparison_1_p_value = 4,
comparison_2_fold_change = 5,
comparison_2_p_value = 6
)
# filter genes which have p-values lower than 0.1 im both comparisons
t_filtered <- t %>%
filter(
comparison_1_p_value <= 0.1,
comparison_2_p_value <= 0.1
)
# calculate density of dots as described on:
# https://slowkow.com/notes/ggplot2-color-by-density/
get_density <- function(x, y, ...) {
dens <- MASS::kde2d(x, y, ...)
ix <- findInterval(x, dens$x)
iy <- findInterval(y, dens$y)
ii <- cbind(ix, iy)
return(dens$z[ii])
}
t_filtered$density <- get_density(
t_filtered$comparison_1_fold_change,
t_filtered$comparison_2_fold_change,
n = 100
)
# build color palette on https://gka.github.io/palettes
colors <- c('#7ac6e7', '#6badd9', '#5c95cb', '#4e7ebd', '#3f66af', '#314fa2',
'#223894', '#132086', '#000275')
p <- t_filtered %>%
arrange(density) %>%
ggplot() +
geom_point(
aes(comparison_1_fold_change, comparison_2_fold_change, color = density),
size = 4, show.legend = FALSE
) +
geom_hline(yintercept = 0, linetype = 'dashed') +
geom_vline(xintercept = 0, linetype = 'dashed') +
theme_bw() +
labs(x = 'logFC - comparison A', y = 'logFC - comparison B') +
scale_color_gradientn(colors = colors)
ggsave('2.png', p, scale = 1, height = 5, width = 6)