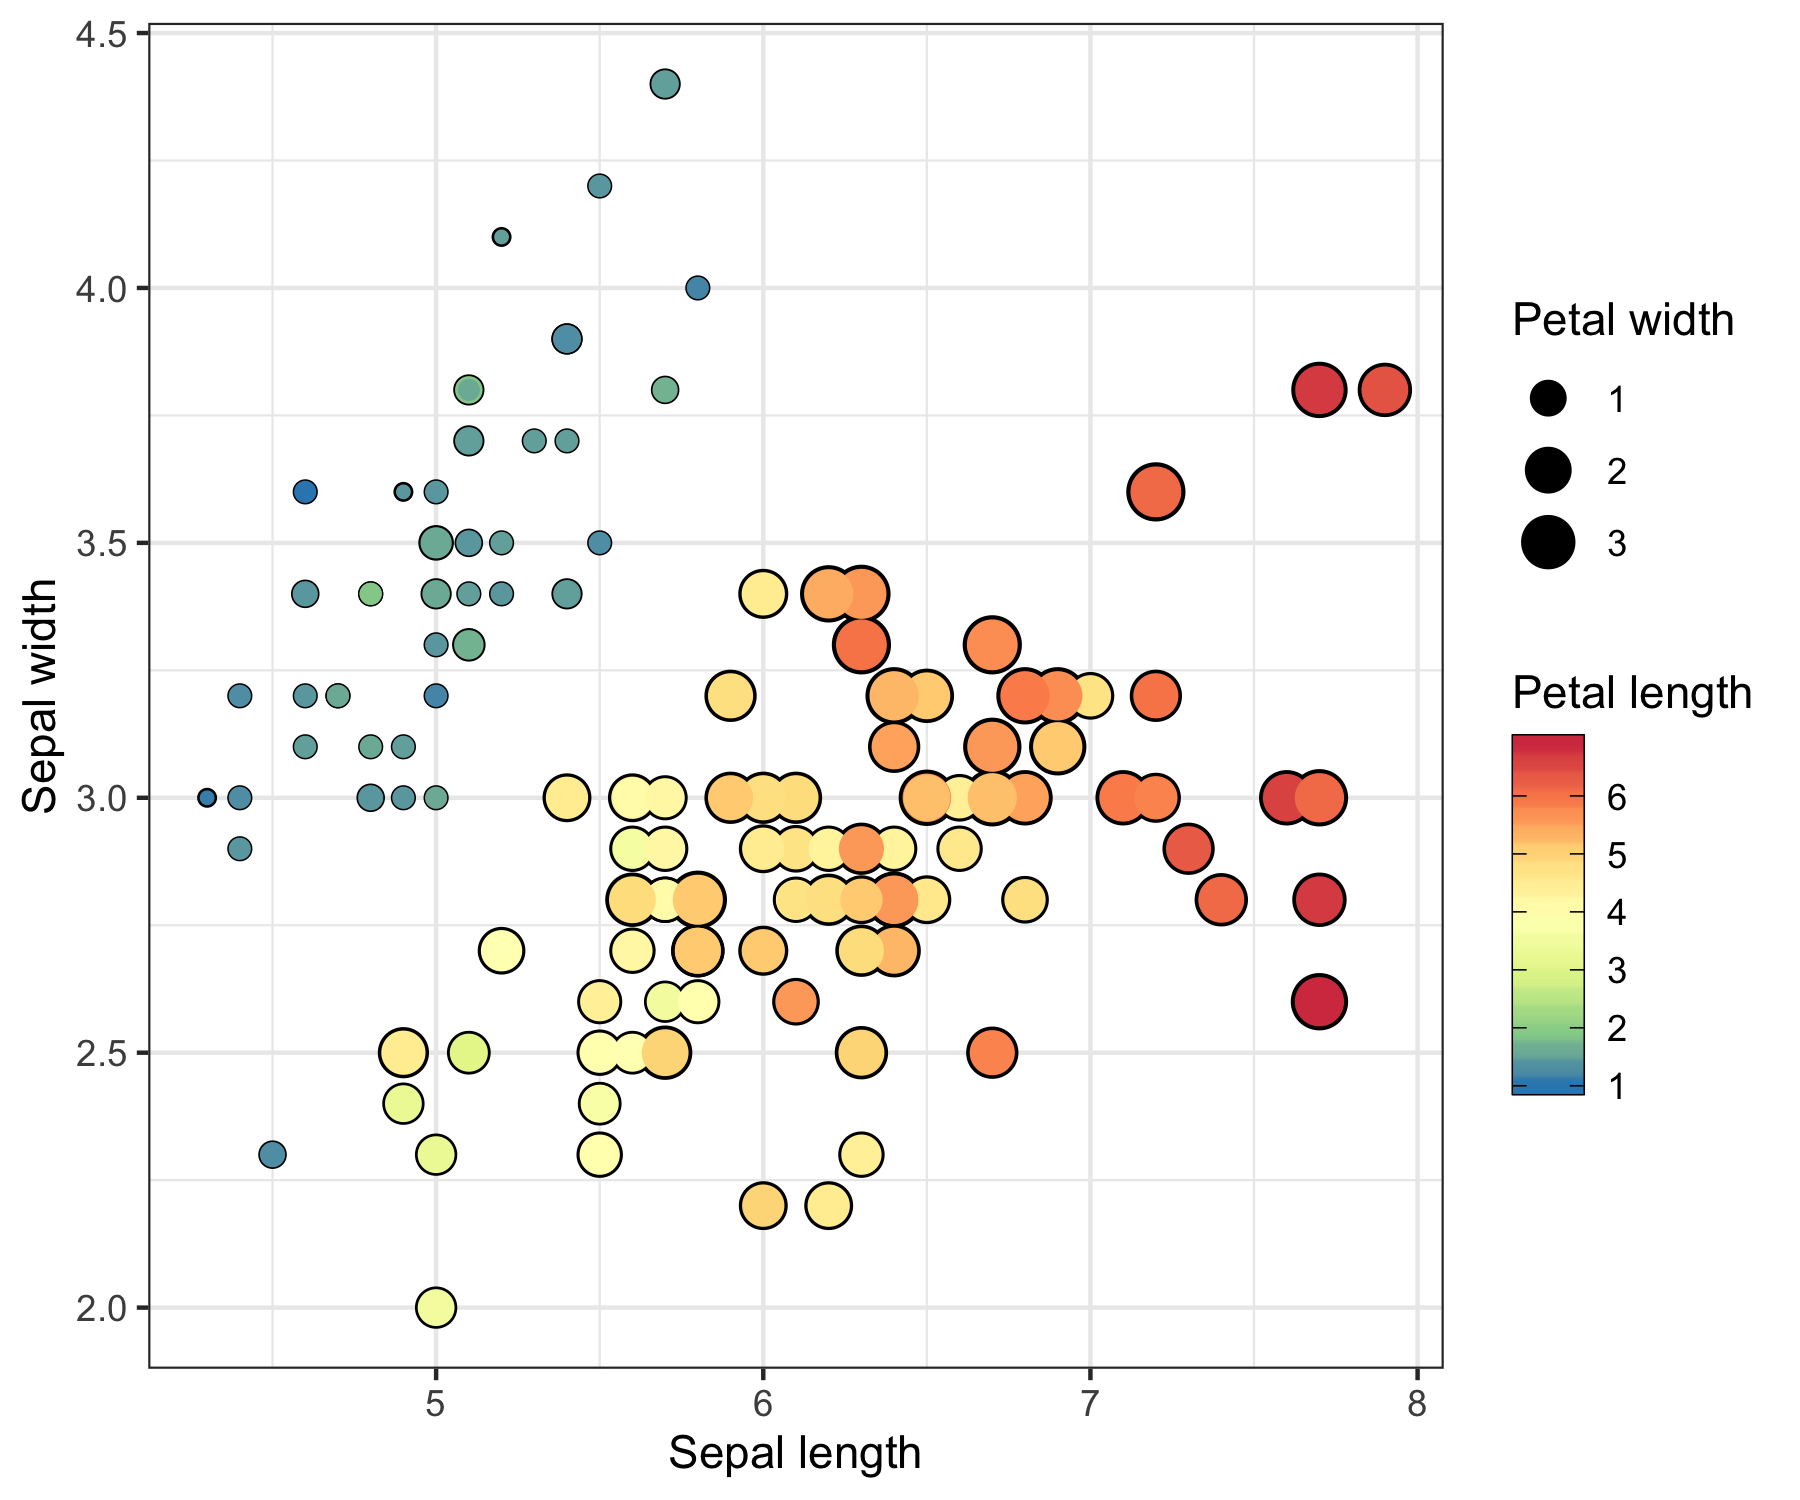
Scatter plot 1
Category: scatter
library(tidyverse)

data(iris)

p <- iris %>%
  mutate(Petal.Width.larger = Petal.Width * 1.5) %>%
  ggplot() +
  geom_point(aes(Sepal.Length, Sepal.Width, size = Petal.Width.larger), color = 'black', show.legend = FALSE) +
  geom_point(aes(Sepal.Length, Sepal.Width, color = Petal.Length, size = Petal.Width)) +
  theme_bw() +
  labs(x = 'Sepal length', y = 'Sepal width', size = 'Petal width') +
  scale_color_distiller(
    palette = 'Spectral', name = 'Petal length',
    guide = guide_colorbar(frame.colour = 'black', ticks.colour = 'black')
  ) +
  theme(legend.position = 'right')

ggsave('1.png', p, height = 5, width = 6)