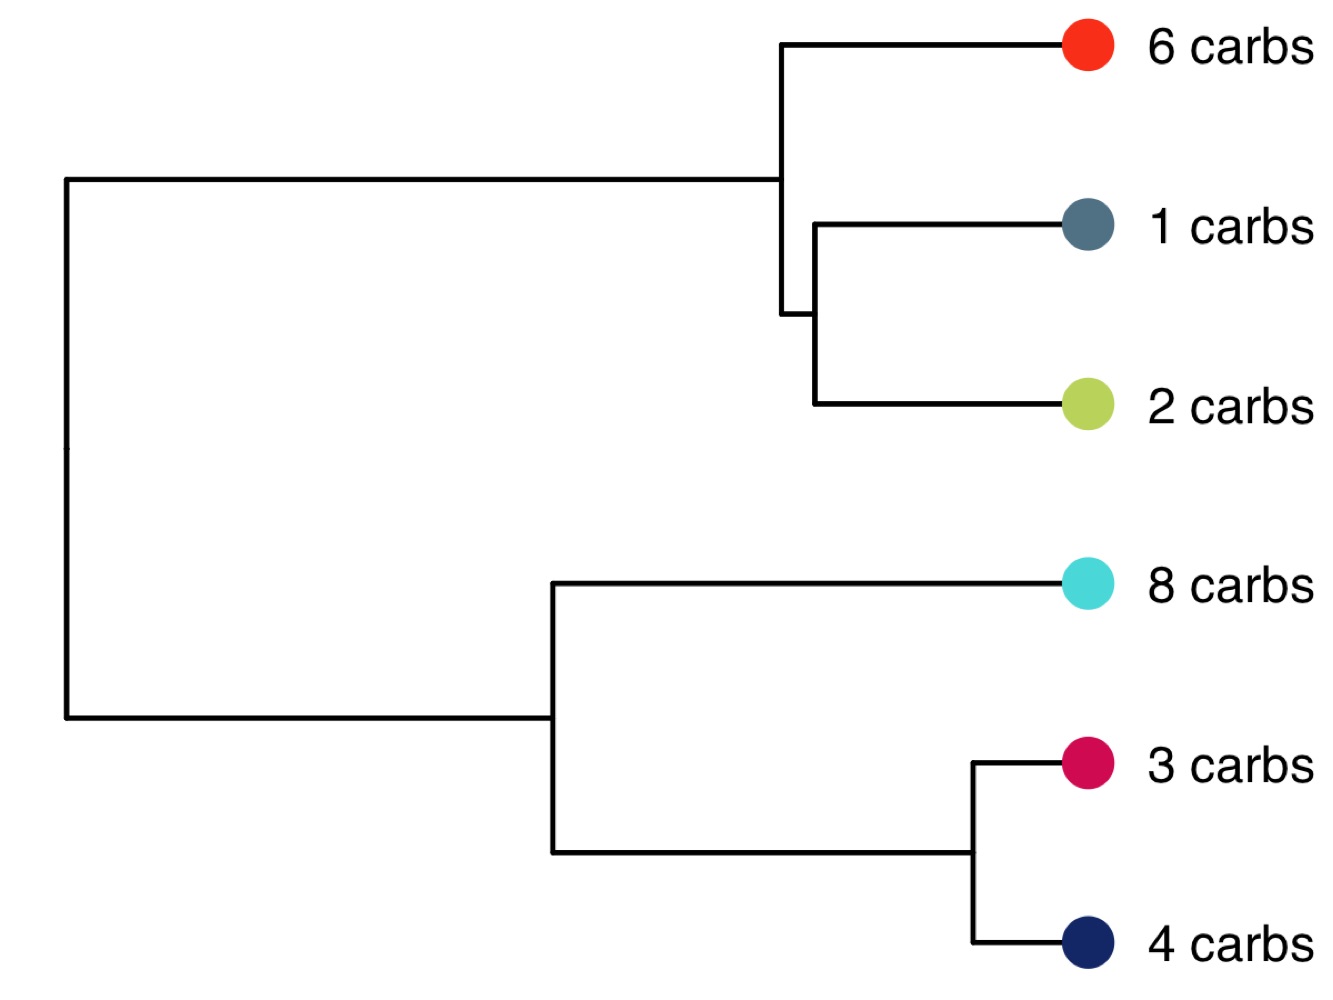
Phylogenetic tree
Category: other

library(tidyverse)
library(jcolors)
library(ggtree)

# load data
data(mtcars)

# choose number of carburetors as group
groups <- mtcars$carb %>% as.character() %>% unique() %>% sort()

# group data by carburetor and calculate means for all features
temp_data <- mtcars %>%
  group_by(carb) %>%
  summarise_all(list(mean = mean)) %>%
  as.matrix()
rownames(temp_data) <- groups

# calculate distance matrix
distance_matrix <- dist(temp_data)

# calculate phylogenetic tree
tree <- ape::as.phylo(hclust(distance_matrix))

# plot
p <- ggtree(tree, aes(x, y)) +
  scale_y_reverse() +
  geom_tree() +
  theme_tree() +
  geom_tiplab(label = paste0(tree$tip.label, ' carbs'), offset = 8) +
  geom_tippoint(color = jcolors('pal5'), shape = 16, size = 5) +
  coord_cartesian(clip = 'off') +
  theme(plot.margin = unit(c(0,1,0,0), 'cm'))
ggsave('phylogenetic_tree.png', p, height = 3, width = 4)