Intensity plot 1
Category: intensity
library(tidyverse)
library(wesanderson)
data(iris)
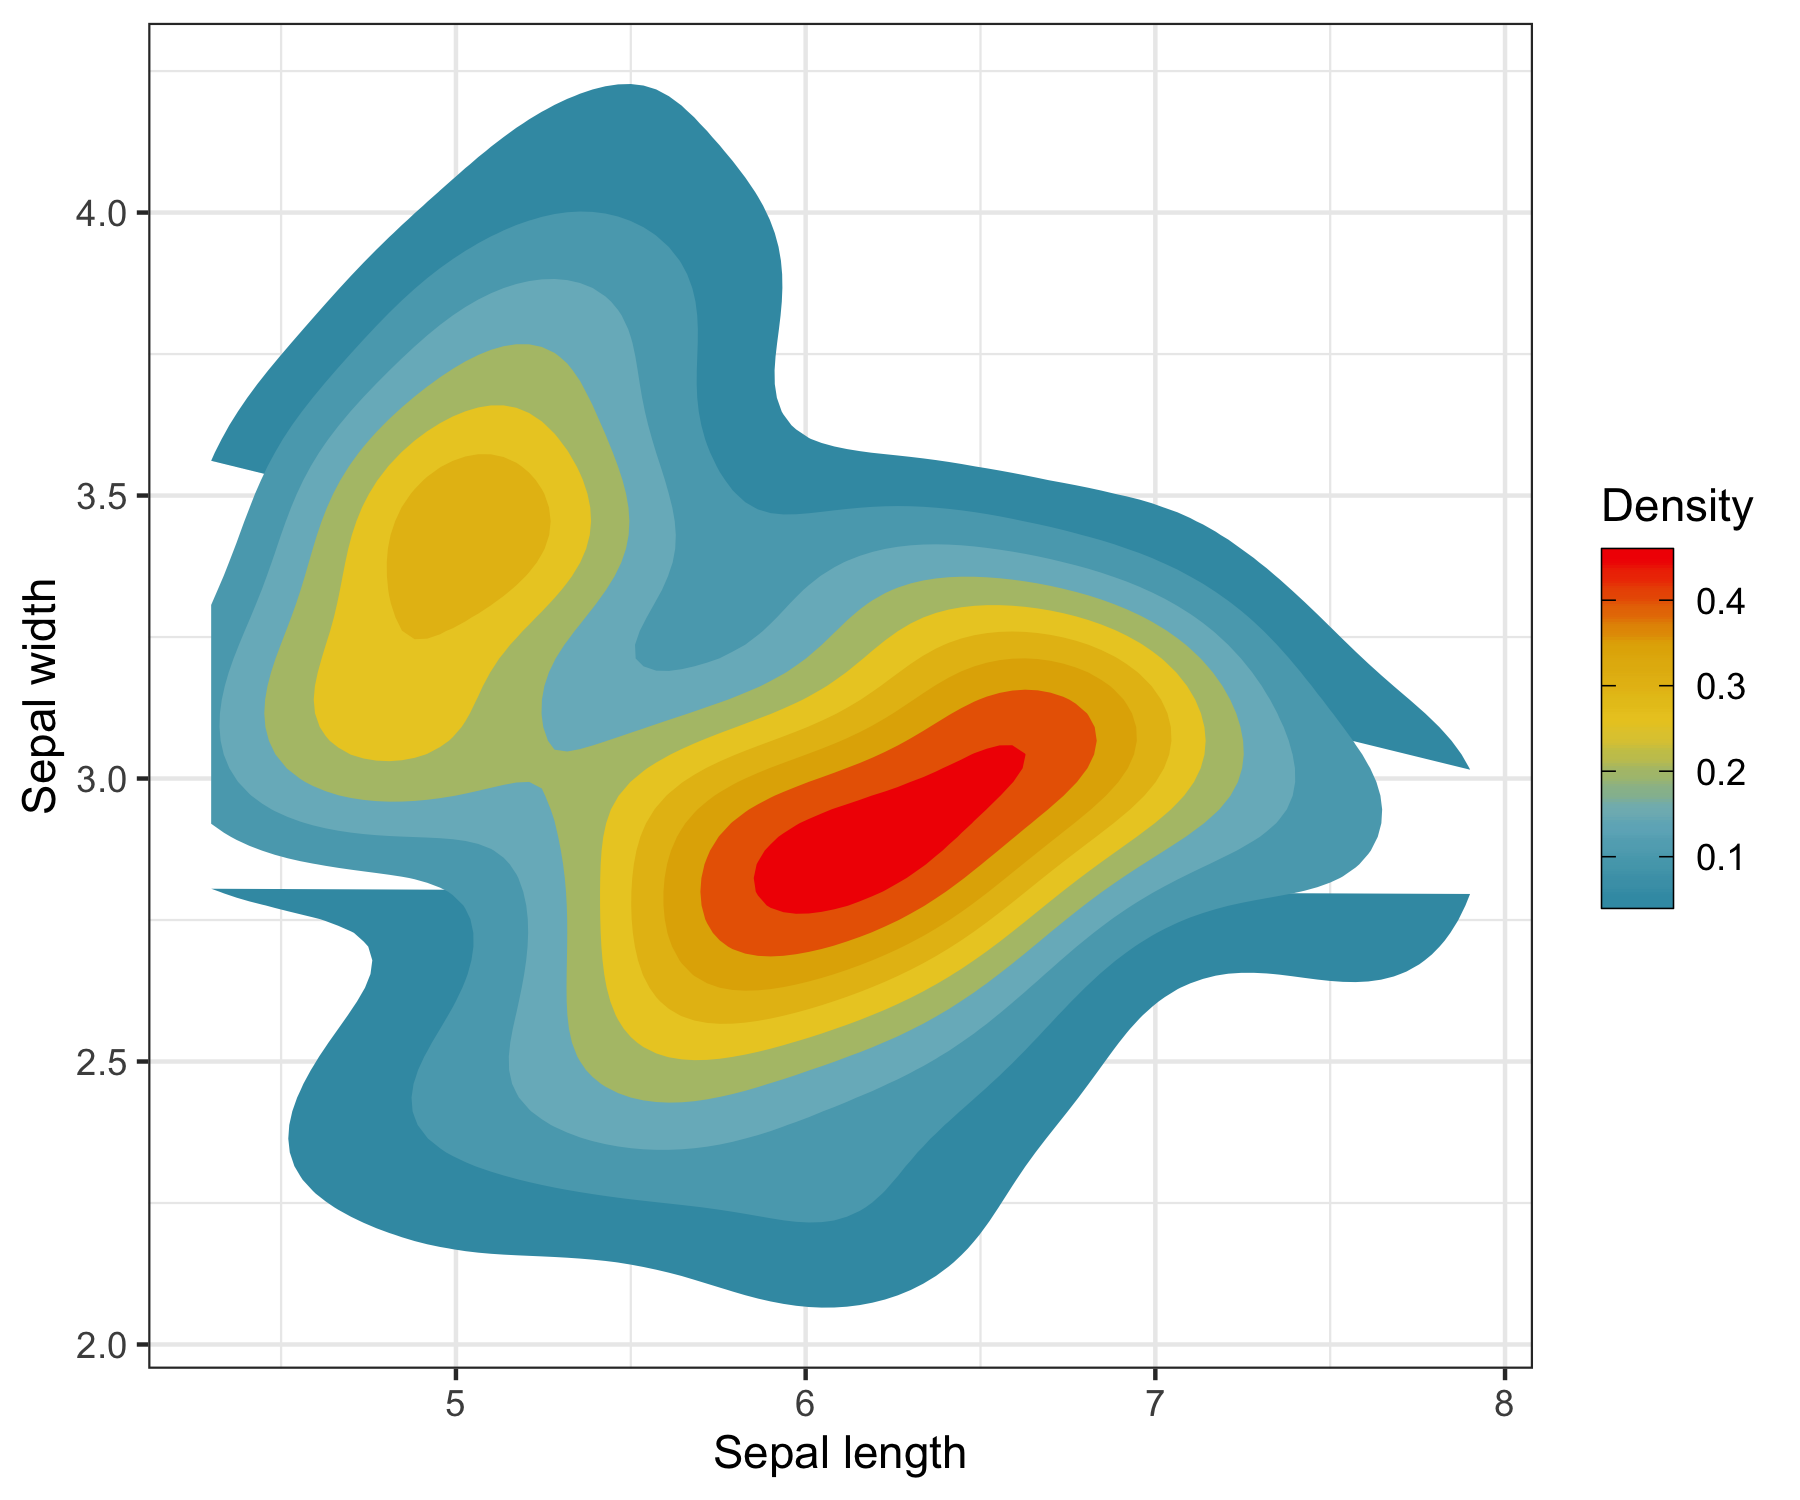
p <- ggplot(iris) +
stat_density_2d(aes(Sepal.Length, Sepal.Width, fill = stat(level)), geom = 'polygon') +
theme_bw() +
labs(x = 'Sepal length', y = 'Sepal width', size = 'Petal width') +
scale_fill_gradientn(
colours = wes_palette('Zissou1', 21, type = 'continuous'),
guide = guide_colorbar(frame.colour = 'black', ticks.colour = 'black')
) +
theme(legend.position = 'right')
ggsave('1.png', p, height = 5, width = 6)