Heatmap 1
Category: heatmap
library(tidyverse)
library(Seurat)
library(ComplexHeatmap)
library(circlize)
library(gridExtra)
library(ggplotify)
# create color palette from flatuicolors.com
colors_dutch <- c(
'#FFC312','#C4E538','#12CBC4','#FDA7DF','#ED4C67',
'#F79F1F','#A3CB38','#1289A7','#D980FA','#B53471',
'#EE5A24','#009432','#0652DD','#9980FA','#833471',
'#EA2027','#006266','#1B1464','#5758BB','#6F1E51'
)
colors_spanish <- c(
'#40407a','#706fd3','#f7f1e3','#34ace0','#33d9b2',
'#2c2c54','#474787','#aaa69d','#227093','#218c74',
'#ff5252','#ff793f','#d1ccc0','#ffb142','#ffda79',
'#b33939','#cd6133','#84817a','#cc8e35','#ccae62'
)
custom_colors <- c(colors_dutch, colors_spanish)
# load a single cell expression data set (generated in the lab I work at)
seurat <- readRDS('seurat.rds')
# calculate average expression value for all variable genes for each cluster
average_expression_profiles_by_cluster <- seurat@assays$RNA@data[seurat@assays$RNA@var.features,] %>%
t() %>%
as.matrix() %>%
as_tibble() %>%
mutate(cluster = seurat@meta.data$seurat_clusters) %>%
select(cluster, everything()) %>%
group_by(cluster) %>%
summarize_all(~mean(.))
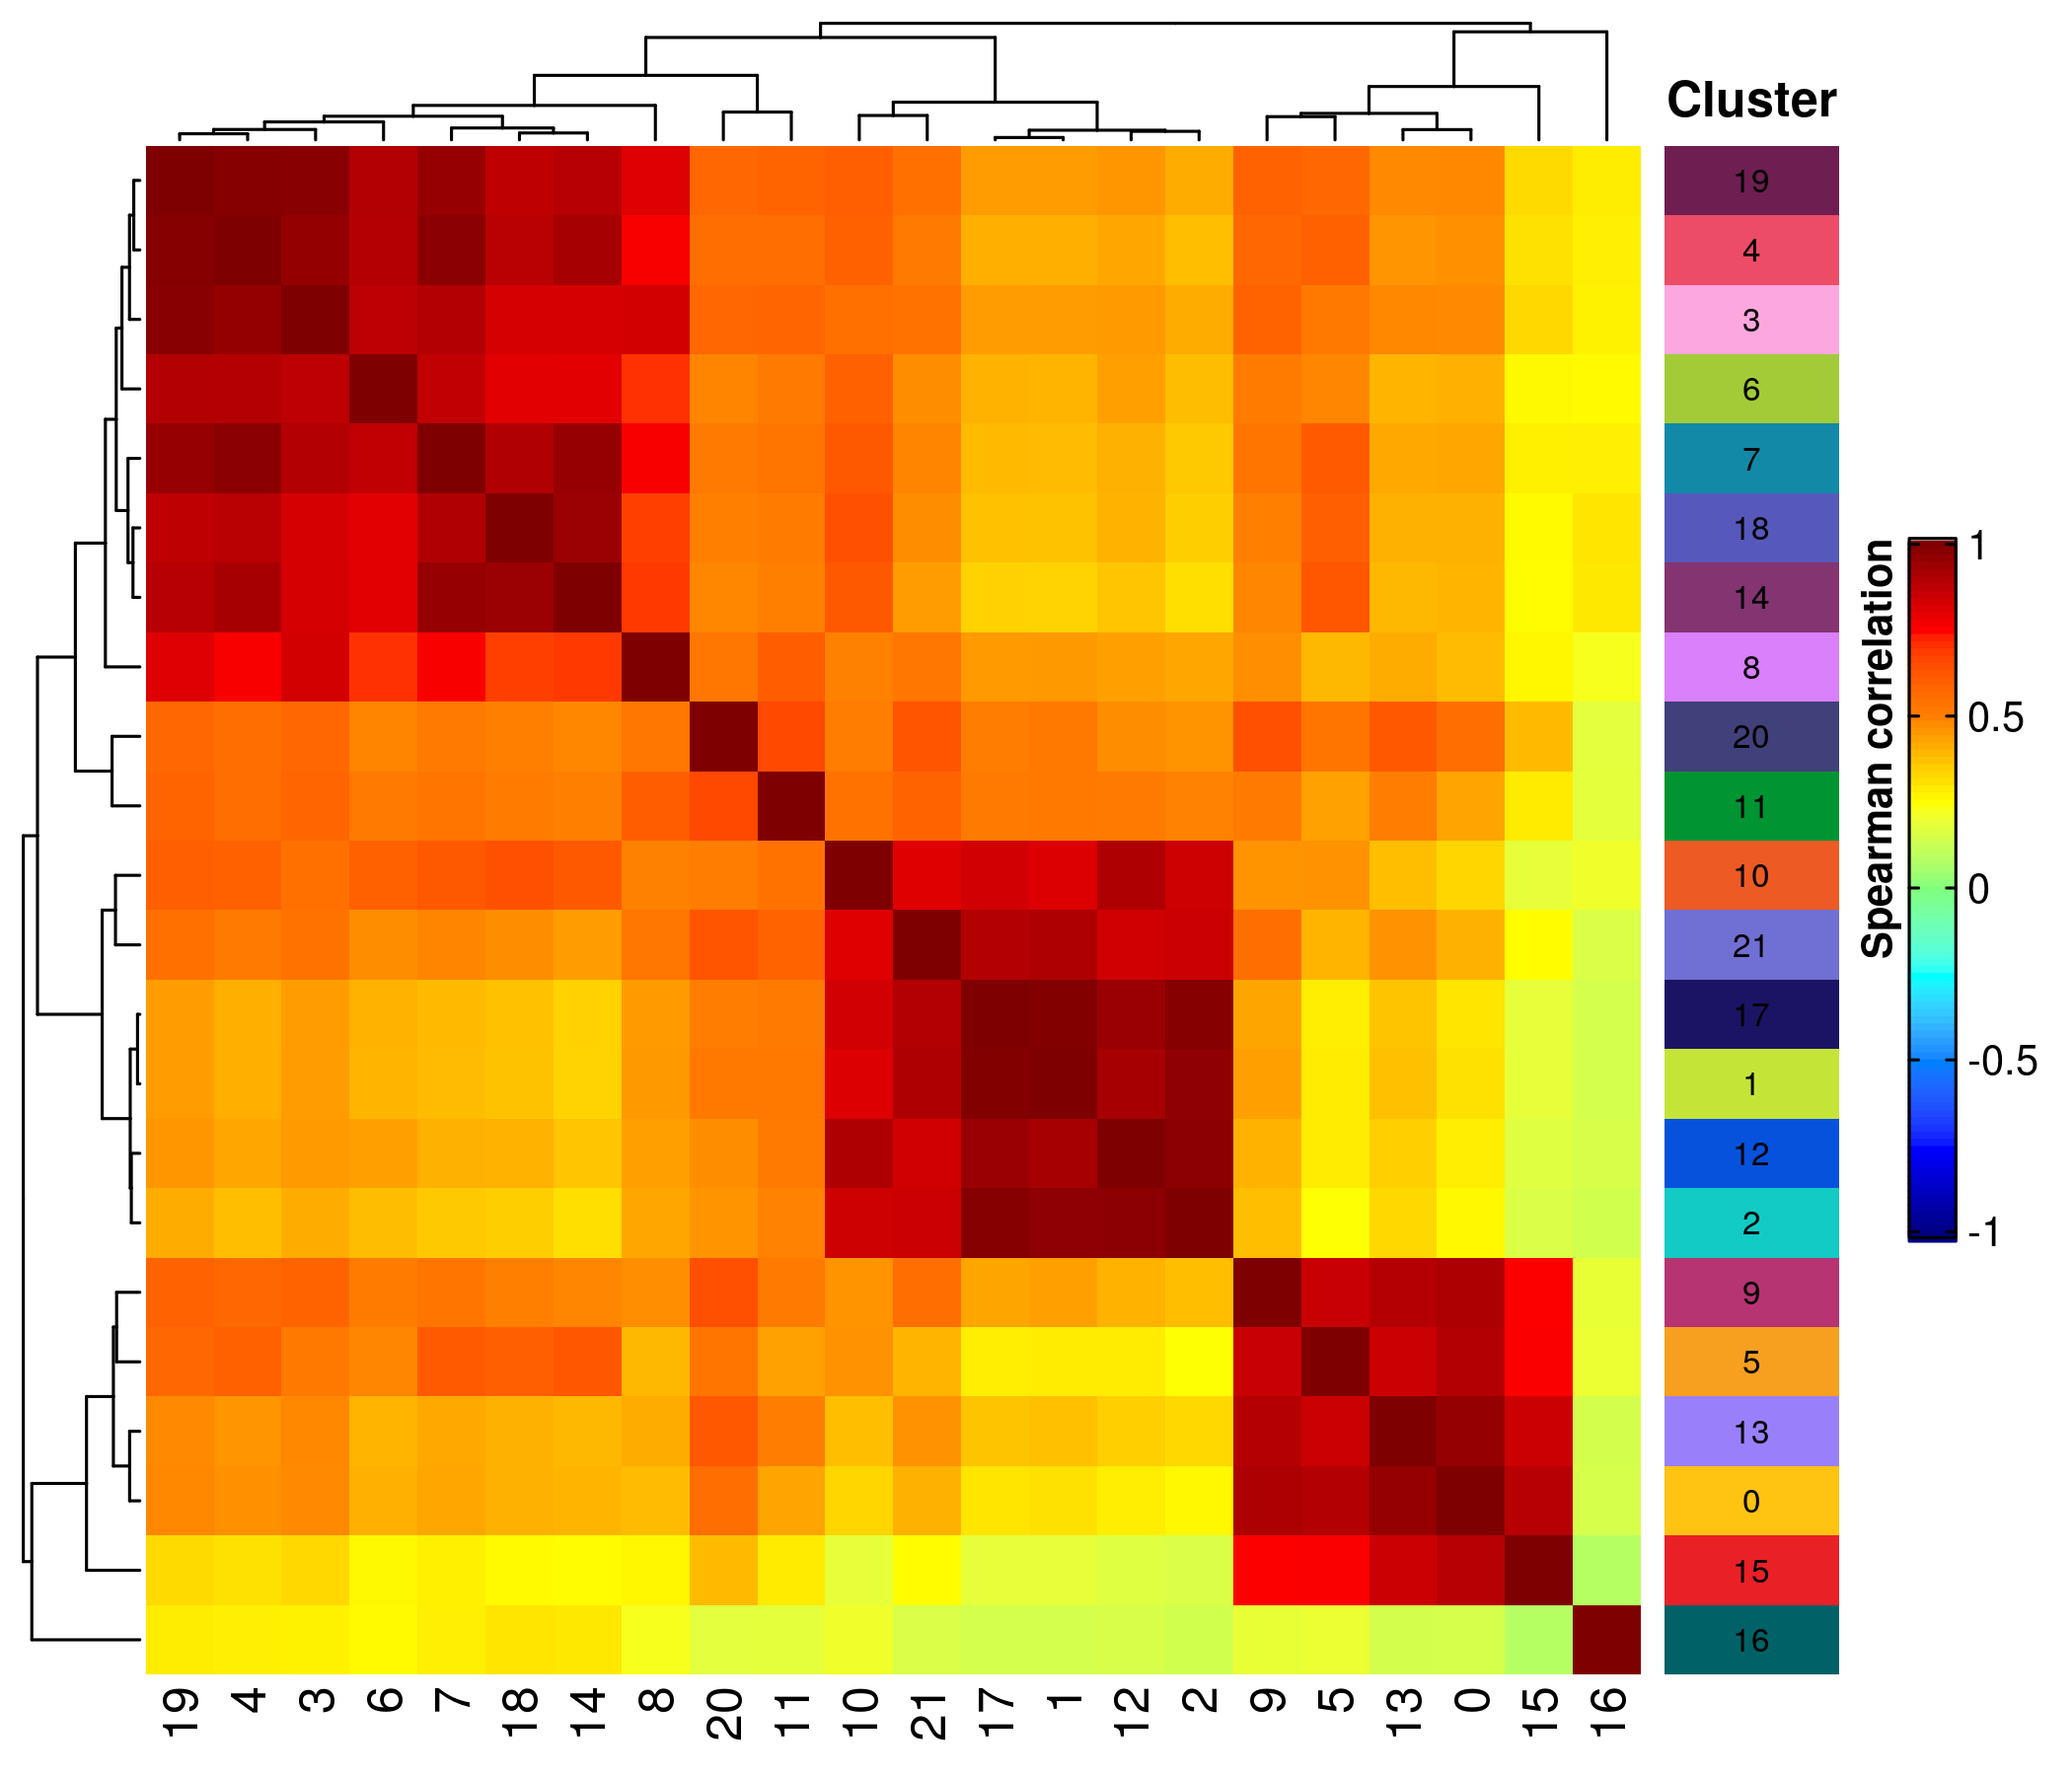
# calculate Spearman correlation matrix
correlation_matrix <- average_expression_profiles_by_cluster %>%
select(-1) %>%
as.matrix() %>%
t() %>%
cor(method = 'spearman')
# assign row and column names
rownames(correlation_matrix) <- levels(seurat@meta.data$seurat_clusters)
colnames(correlation_matrix) <- levels(seurat@meta.data$seurat_clusters)
# save cluster names for later
cluster <- rownames(correlation_matrix)
# assign a color to each cluster
colors_for_clusters <- c(custom_colors$discrete[1:length(cluster)])
names(colors_for_clusters) <- cluster
# create annotation function
func_cell_cluster <- function(i, j, x, y, width, height, fill) {
grid.text(cluster[j], x = x, y = y, gp = gpar(fontsize = 8))
}
# create main heatmap
ht_matrix <- Heatmap(
correlation_matrix,
name = 'Spearman\ncorrelation',
col = colorRamp2(
c(-1, -0.75, -0.5, -0.25, 0, 0.25, 0.5, 0.75, 1),
c('#00007F', 'blue', '#007FFF', 'cyan', '#7FFF7F', 'yellow', '#FF7F00', 'red', '#7F0000')
),
cluster_rows = TRUE,
cluster_columns = TRUE,
show_row_names = TRUE,
show_column_names = TRUE,
heatmap_legend_param = list(
title = 'Spearman correlation',
legend_height = unit(6, 'cm'),
legend_width = unit(1, 'cm'),
title_position = 'lefttop-rot',
border = 'black'
)
)
# create heatmap for annotation of clusters
ht_cluster <- Heatmap(
cluster,
name = 'Cluster',
cell_fun = func_cell_cluster,
show_row_names = FALSE,
show_column_names = FALSE,
width = unit(15, 'mm'),
col = colors_for_clusters,
show_heatmap_legend = FALSE,
top_annotation = HeatmapAnnotation(
cn = anno_text('Cluster', rot = 0, just = 'center', gp = gpar(fontface = 'bold')),
height = max_text_height('Cluster')
)
)
# plot
p <- as.ggplot(grid.grabExpr(draw(ht_matrix + ht_cluster)))
ggsave('1.png', p, height = 6, width = 7)