Distribution plot 2
Category: distribution
library(tidyverse)
library(gghalves)
library(wesanderson)
# https://github.com/allisonhorst/palmerpenguins
library(palmerpenguins)
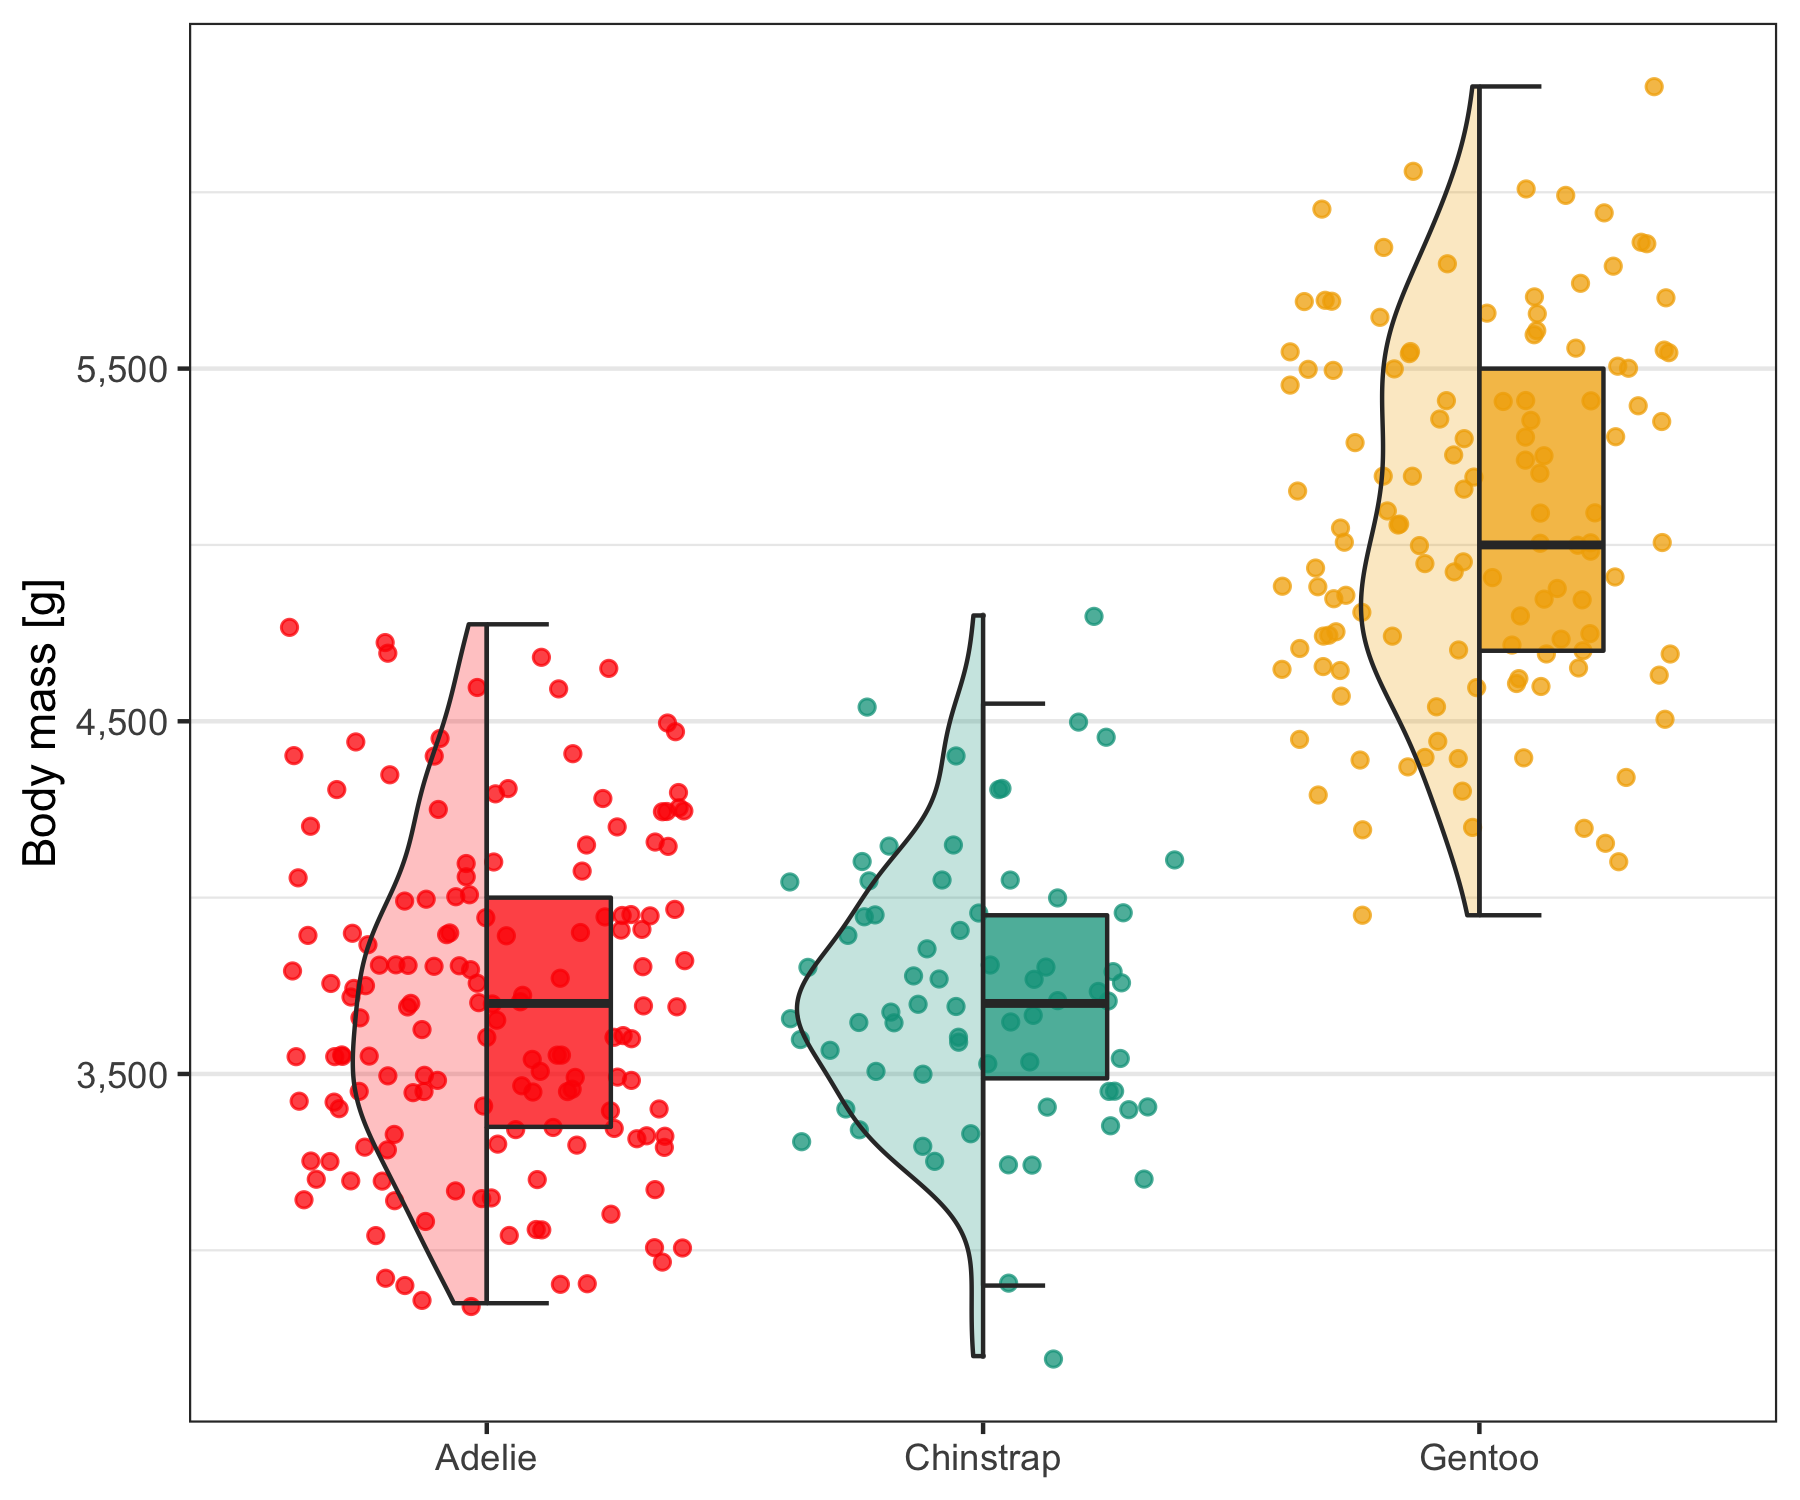
p <- ggplot(penguins, aes(species, body_mass_g)) +
geom_jitter(aes(color = species), alpha = 0.75, size = 1.5, show.legend = FALSE) +
geom_half_violin(aes(fill = species), side = 'l', alpha = 0.25, show.legend = FALSE) +
geom_half_boxplot(aes(fill = species), side = 'r', outlier.size = 0, width = 0.5, alpha = 0.75, show.legend = FALSE) +
scale_color_manual(values = wes_palette('Darjeeling1', 3, type = 'discrete')) +
scale_fill_manual(values = wes_palette('Darjeeling1', 3, type = 'discrete')) +
scale_y_continuous(labels = scales::comma) +
theme_bw() +
labs(y = 'Body mass [g]') +
theme(
axis.title.x = element_blank(),
panel.grid.major.x = element_blank()
)
ggsave('2.png', p, height = 5, width = 6)