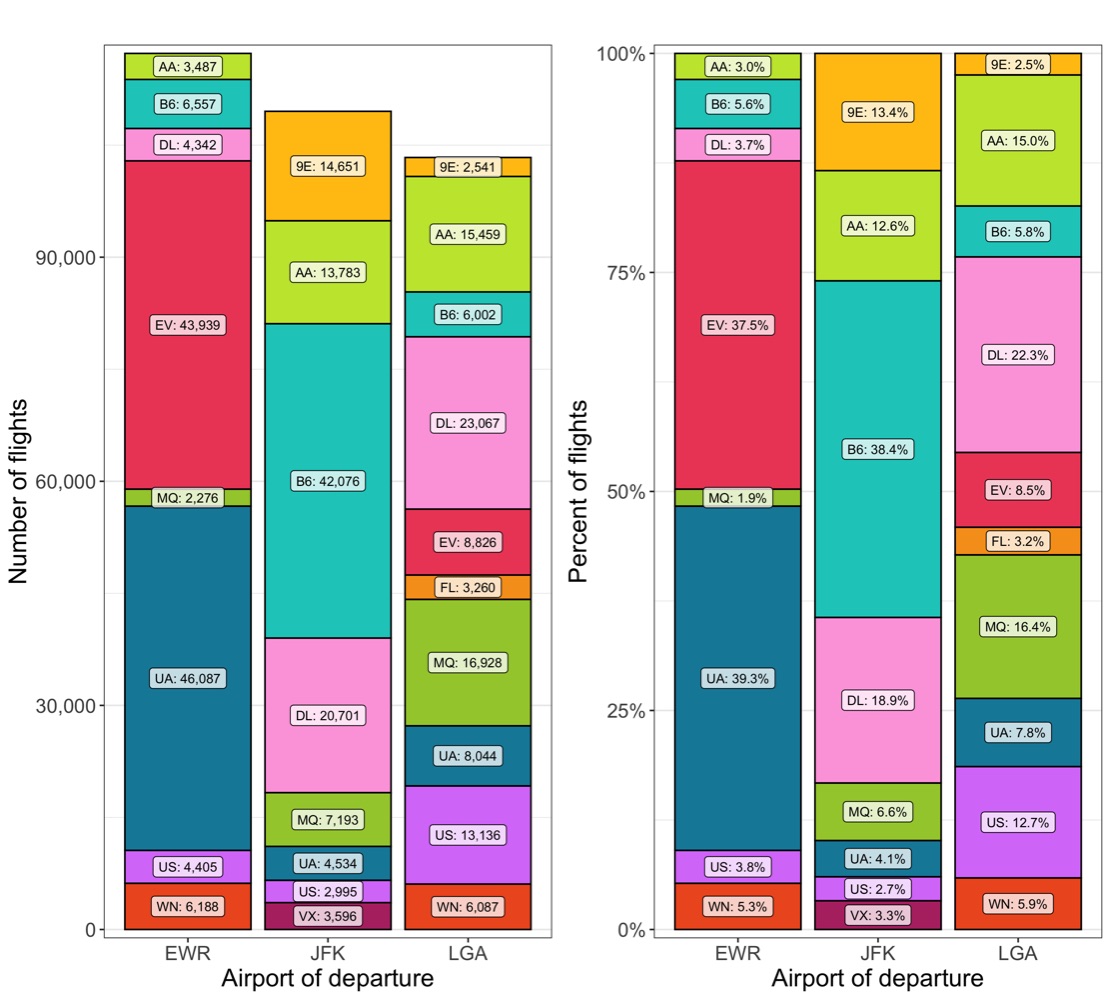
Showing compositions in a bar plot
Category: bar

library(tidyverse)
library(patchwork)
library(plyr)
library(nycflights13)

colors_dutch <- c(
  '#FFC312','#C4E538','#12CBC4','#FDA7DF','#ED4C67',
  '#F79F1F','#A3CB38','#1289A7','#D980FA','#B53471',
  '#EE5A24','#009432','#0652DD','#9980FA','#833471',
  '#EA2027','#006266','#1B1464','#5758BB','#6F1E51'
)

colors_spanish <- c(
  '#40407a','#706fd3','#f7f1e3','#34ace0','#33d9b2',
  '#2c2c54','#474787','#aaa69d','#227093','#218c74',
  '#ff5252','#ff793f','#d1ccc0','#ffb142','#ffda79',
  '#b33939','#cd6133','#84817a','#cc8e35','#ccae62'
)

custom_colors <- c(colors_dutch, colors_spanish)

data(flights)

t <- flights %>%
  dplyr::select(origin, carrier) %>%
  group_by(origin, carrier) %>%
  tally() %>%
  ungroup() %>%
  filter(n > 2000) %>%
  mutate(carrier = factor(carrier, levels = carrier %>% unique() %>% sort()))

t_labels_number <- t %>%
  mutate(carrier = as.character(carrier)) %>%
  mutate(carrier = factor(carrier, levels = carrier %>% unique() %>% sort(decreasing = TRUE))) %>%
  arrange(origin, carrier) %>%
  plyr::ddply('origin', transform, pos = cumsum(n) - (0.5 * n))

p1 <- ggplot() +
  geom_bar(data = t, aes(origin, n, fill = carrier), color = 'black', stat = 'identity') +
  geom_label(
    data = t_labels_number,
    aes(x = origin, y = pos, label = paste0(carrier, ': ', scales::comma(n)), group = carrier),
    alpha = 0.75,
    size = 3,
    fill = 'white',
    color = 'black'
  ) +
  scale_fill_manual(values = custom_colors) +
  scale_y_continuous(labels = scales::comma, expand = c(0.01,0)) +
  labs(x = 'Airport of departure', y = 'Number of flights', fill = 'Carrier') +
  theme_bw() +
  theme(
    legend.position = 'none',
    plot.title = element_text(hjust = 0.5),
    text = element_text(size = 16),
    panel.grid.major.x = element_blank(),
    panel.grid.minor.x = element_blank()
  )

inv_cumsum <- function(x) {
  sum(x) - cumsum(x) + x
}

t_labels_percent <- plyr::ddply(
  t, 'origin', plyr::mutate,
  prop = n / sum(n),
  cumprop = inv_cumsum(n) / sum(n),
  ylabel = (inv_cumsum(n) - n / 2) / sum(n)
)

p2 <- ggplot() +
  geom_bar(data = t, aes(origin, n, fill = carrier), color = 'black', position = 'fill', stat = 'identity') +
  geom_label(
    data = t_labels_percent,
    aes(x = origin, y = ylabel, label = paste0(carrier, ': ', scales::percent(prop, accuracy = 0.1)), group = carrier),
    alpha = 0.75,
    size = 3,
    fill = 'white',
    color = 'black'
  ) +
  scale_fill_manual(values = custom_colors) +
  scale_y_continuous(labels = scales::percent_format(), expand = c(0.01,0)) +
  ggtitle('') +
  labs(x = 'Airport of departure', y = 'Percent of flights', fill = 'Carrier') +
  theme_bw() +
  theme(
    legend.position = 'none',
    plot.title = element_text(hjust = 0.5),
    text = element_text(size = 16),
    panel.grid.major.x = element_blank(),
    panel.grid.minor.x = element_blank()
  )

ggsave('flights_by_airport_and_carrier.png', p1 + p2, height = 9, width = 10)