Visualizing resources managed by a PBS job scheduler
At the research institute I currently work at, we use PBS as a job scheduler for collaborative use and research management of the HPC cluster. Just for a little background info, the cluster consists of 14 computers which are connected to make the cluster. Two of those 14 are masters, one of them being a backup of the first. The master isn’t supposed to be used to for computation because its main job is to distribute the work between the other machines. The other 12 computers, also called nodes, are those which we do all our work on. The job scheduler runs on the master and assigns jobs to the nodes. A job is a set of operation you need to be done and which is saved in a script which you hand over to the job scheduler with the request to execute it. In bioinformatics, a good example would be the alignment of reads to a reference genome. As mentioned before, we use PBS but there are others out there, e.g. SGE or Slurm. Which node gets to do which job depends on the resources (number of CPUs and memory) each job requests. Ideally, this allows efficient resource usage so that everybody gets their job done the quickest.
Now you might ask me: “But Roman, how does the job scheduler know what resources a job needs?” That is a fantastic question. The answer is simple: It doesn’t know. The user must specify the required resources.
“And what happens if you don’t do it?” Again, great question and very simple answer: The scheduler will treat it as if the jobs only needs the default values (e.g. 1 CPU and no specific memory requirements). This is a real problem because if the resources are not specified, the scheduler can’t do its job. And that, finally, brings me to what this article is about.
We had a few users who flooded the cluster with jobs, many of them without properly specified resources, which made the computation for everybody painfully slow. Interactive session (which are treated as jobs just like scripts) were almost impossible.
Unfortunately, the PBS job scheduler only offers unsatisfying ways to understand what is going on in a particular moment. You can ask for a list of running and queued jobs but you just see the names and status, not the requested resources. See below for an example:
Job id            Name             User              Time Use S Queue
----------------  ---------------- ----------------  -------- - -----
job.1             STDIN            user1             xx:xx:xx R turbovnc
job.2             align_STAR       user2             xx:xx:xx R workq
To see all the details, you must send a query for each job separately (see below).
Job Id: <job_id>
    Job_Name = <job_name>
    Job_Owner = <user>@<host>.cluster.local
    resources_used.cpupercent = 264
    resources_used.cput = 00:23:21
    resources_used.mem = 55966724kb
    resources_used.ncpus = 16
    resources_used.vmem = 160963084kb
    resources_used.walltime = 01:30:22
    job_state = R
    queue = workq
    server = <host>.cluster.loc
    Checkpoint = u
    ctime = Tue May  7 09:31:20 2019
    Error_Path = <host>.cluster.loc:<some_path>
    exec_host = <node>/0*16
    exec_vnode = (<node>:ncpus=16)
    Hold_Types = n
    Join_Path = oe
    Keep_Files = n
    Mail_Points = a
    mtime = Tue May  7 09:31:21 2019
    Output_Path = <host>.cluster.loc:<some_path>
    Priority = 0
    qtime = Tue May  7 09:31:20 2019
    Rerunable = True
    Resource_List.mpiprocs = 16
    Resource_List.ncpus = 16
    Resource_List.nodect = 1
    Resource_List.nodes = 1:ppn=16
    Resource_List.place = scatter
    Resource_List.select = 1:ncpus=16:mpiprocs=16
    stime = Tue May  7 09:31:21 2019
    session_id = 15962
    jobdir = <some_path>
    substate = 42
    Variable_List = <...>
    comment = Job run at Tue May 07 at 09:31 on (cn02:ncpus=16)
    etime = Tue May  7 09:31:20 2019
    umask = 22
    run_count = 1
    Submit_arguments = <...>
    project = _pbs_project_default
When there are around 50 jobs in the list, you can’t do that manually. And so I did what every lazy coder would do: Automatize the steps (get a list of currently running or queued jobs and get the details for each of them), parse the details (the details for each job are not in column format), and visualize the results in a nice interface. For the lack of a better name, I shall call it ‘PBSviewer’ for now. This allowed me to get a live view of the jobs, and, more importantly, identify those which ask for many resources but use very few, or worse, ask for no resources and use many. Also, you can see if there are users who might need a reminder of how important resource management is. I also implemented a way to track the resources of each node over time (number of free CPUs and free memory) which was a little tricky to figure out. This feature could also be improved (actually, probably every aspect of this tool can be improved) because every time you reload the window the data is reset. Data is collected once a minute while the app is running.
Since I wanted to use Shiny for the data visualization, I decided to also perform the first two of those steps in R (and send system commands from inside R).
The tables allow filtering, some values (number of CPUs and memory usage) get color highlighting, plots are interactive and exportable.
In the nodes panel, one can select nodes (single/multiple) to get highlights of just that node. Otherwise, the jobs of all nodes are shown. The input data for this looks like this:
                                                        mem       ncpus   nmics   ngpus
vnode           state           njobs   run   susp      f/t        f/t     f/t     f/t   jobs
--------------- --------------- ------ ----- ------ ------------ ------- ------- ------- -------
node01          free                 2     2      0   36gb/126gb    8/28     0/0     0/0 job.1,job.2
node02          free                 0     0      0  126gb/126gb   11/28     0/0     0/0 --
So far I haven’t done a great job at documenting the respective GitHub repository, but feel free to have a look anyway.
Maybe this is of help to anyone. I think it would be great to run this as a web service by the administrators, or perhaps a pimped version of it, accessible to all users.
Since, at least in principle, I wanted this to be readily applicable to other people working with HPC and PBS job schedulers, and because I didn’t want to hard-code my user credentials into the app, one must first specify the address of the master, along with user name and password. Beyond that, you might have to adapt the text parsing of the job details since I had to specify widths of columns and length of output which could be different on your system.
Below you can find some screenshots:
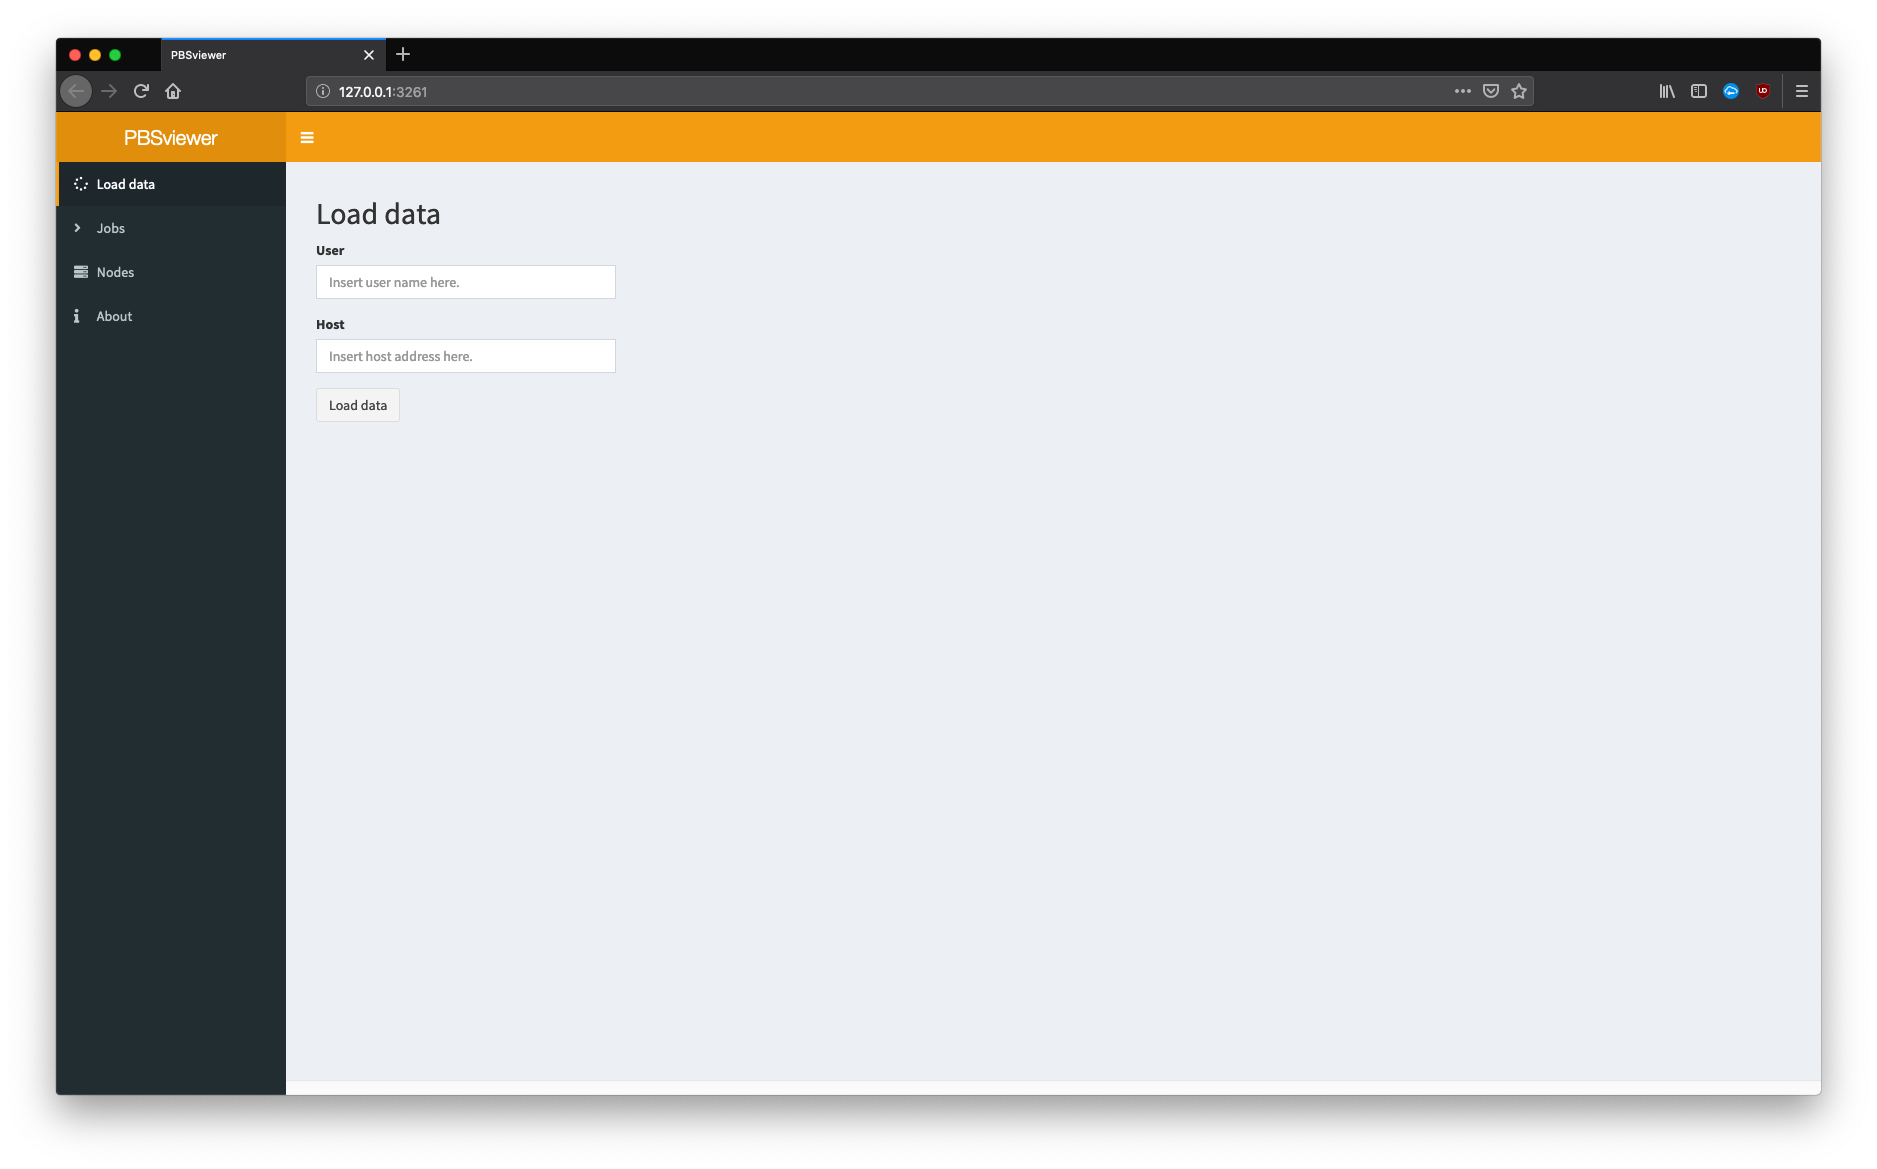
Login panel: You need to provide username and address of the cluster.
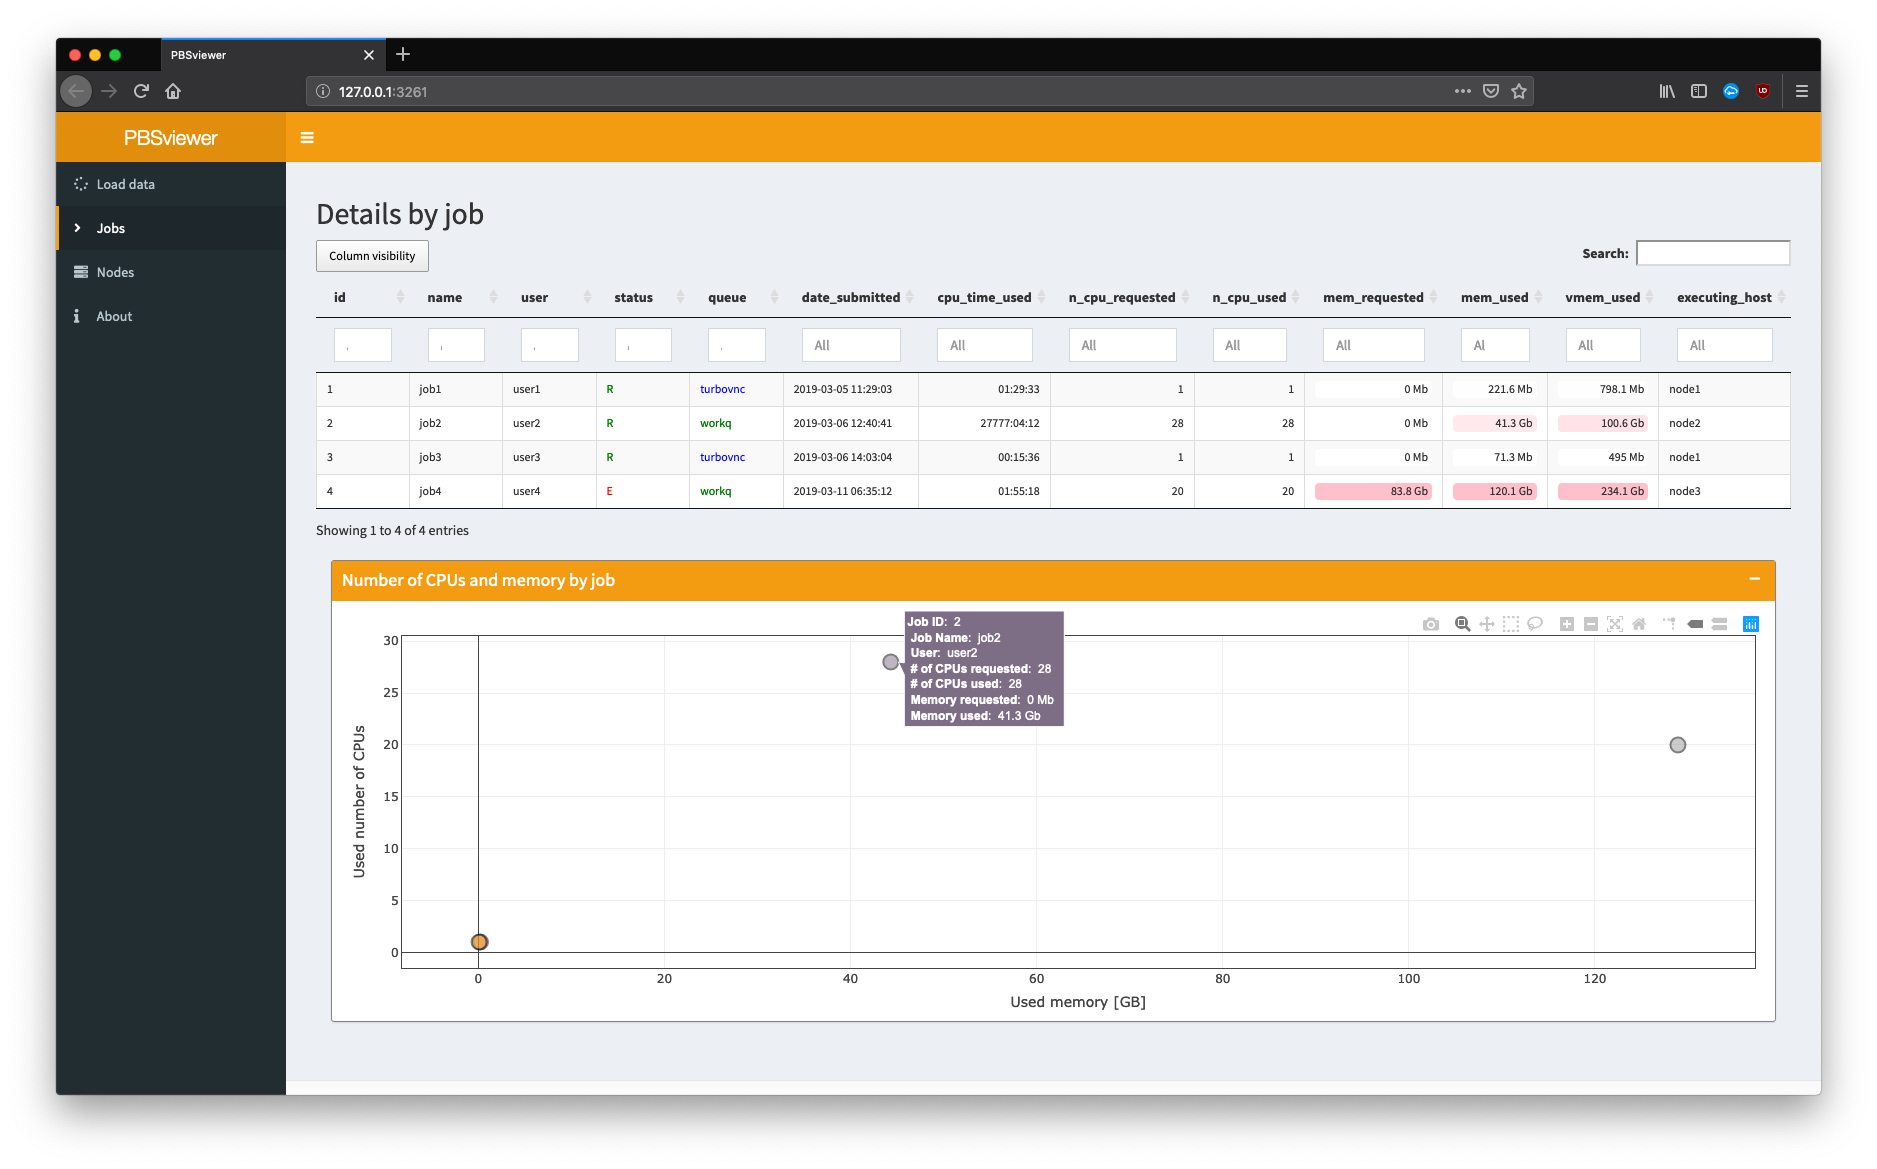
Table of jobs and plot of number of CPUs over memory usage of each job.
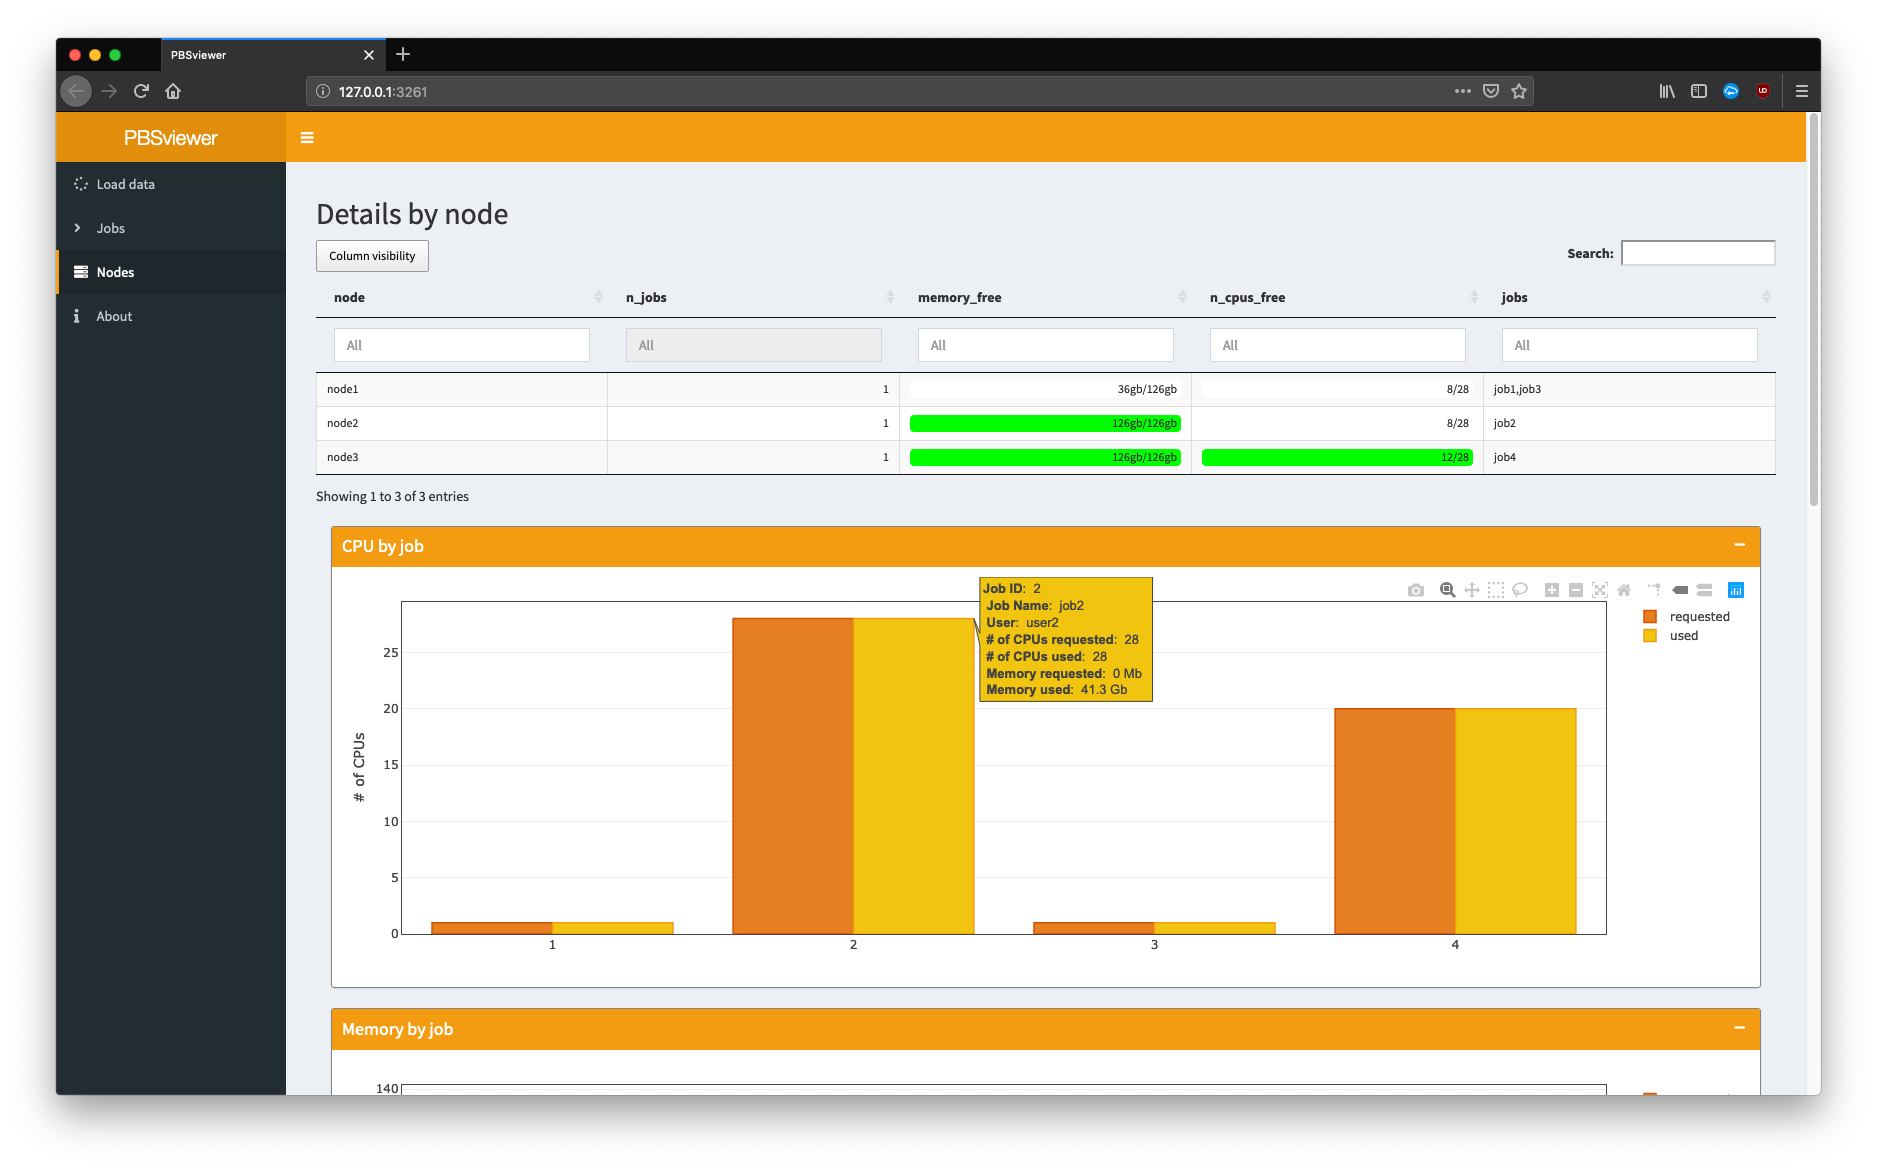
Overview of nodes and plot of number of CPUs requested (orange) and used (yellow) for each job.
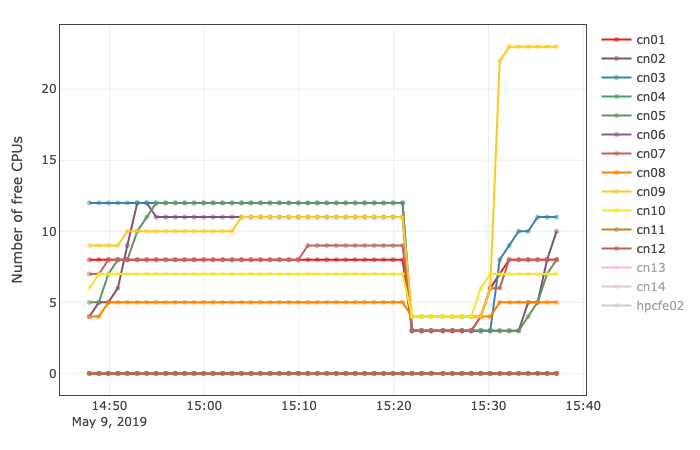
Example plot of number of available CPUs per node over time.