Cases of coronavirus (ongoing)
Mar 13, 2020
Introduction
A colleague of mine (hey 👋 @lost_efano) showed me this R package coronavirus which collects data about the virus.
I simply couldn’t resist to plot some of the data.
library(tidyverse)
library(coronavirus)

## change some country names in the coronavirus data
coronavirus_tmp <- coronavirus %>%
  filter(type == 'confirmed') %>%
  rename(country = Country.Region) %>%
  select(date,country,cases) %>%
  mutate(
    country = ifelse(grepl(country, pattern = '^Mainland China$'), 'China', country),
    country = ifelse(grepl(country, pattern = '^North Macedonia$'), 'Macedonia', country),
    country = ifelse(grepl(country, pattern = '^US$'), 'United States', country),
    country = ifelse(grepl(country, pattern = '^UK$'), 'United Kingdom', country)
  )

## create vector of unique countries and dates
countries <- unique(coronavirus_tmp$country) %>% sort()
dates <- unique(coronavirus_tmp$date) %>% sort()

## assign 0 cases to all countries without record
zero_cases <- tibble(
  country = countries,
  cases = 0
)

## skeleton for summed up data
data_summed_up <- tibble(
  date = character(),
  country = character(),
  code = character(),
  cases = numeric()
)

## for every recoded date, sum up the number of cases up until then
for ( i in seq(length(dates)) ) {
  temp_cases <- coronavirus_tmp %>%
    filter(date <= dates[i]) %>%
    bind_rows(zero_cases) %>%
    group_by(country) %>%
    summarize(cases = sum(cases)) %>%
    mutate(date = as.character(dates[i]))
  data_summed_up <- bind_rows(
    data_summed_up,
    temp_cases
  )
}

## create log-scaled version of cases for plotting (colors look better)
data_summed_up <- data_summed_up %>%
  mutate(
    date = factor(date, levels = unique(date)),
    cases_log = log10(cases+1)
  )
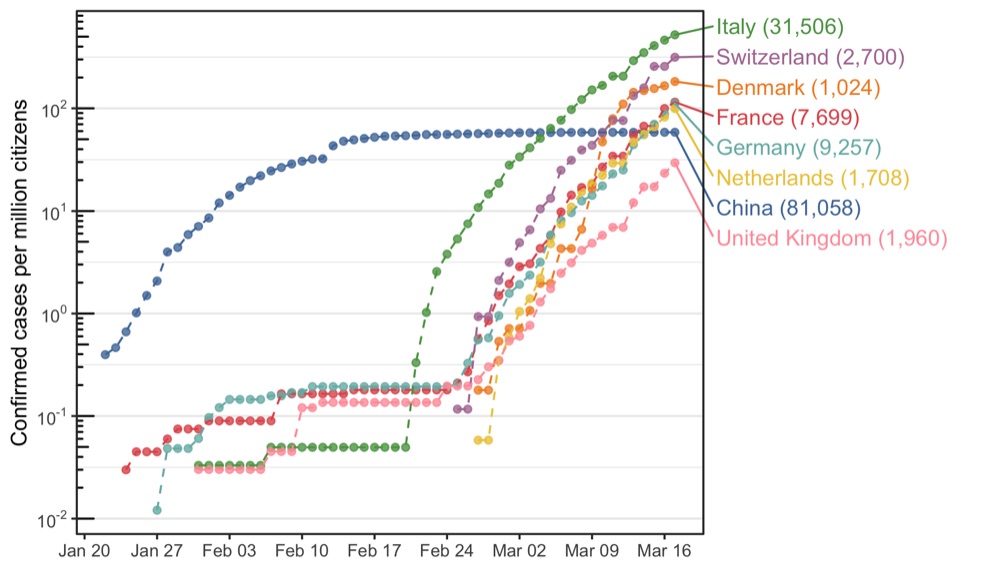
Highlight of specific countries
With labels
This plot wouldn’t have been possible without the help of these guys: https://stackoverflow.com/questions/54191372/log-scale-minor-tick-marks-on-outside-of-the-axis-line-with-annotation-logticks
The annotation_logticks() and coord_cartesian(clip = 'off') options results in log ticks outside of the plot which were removed by drawing a rectangle on top of them. Ingenious.
library(tidyverse)
library(coronavirus)
library(ggrepel)
library(ggthemes)
library(grid)

population_sizes <- tribble(
  ~country,         ~population_size,
  'Italy',          60.48,
  'France',         66.89,
  'Germany',        82.79,
  'Switzerland',    8.57,
  'United Kingdom', 66.44,
  'Netherlands',    17.18,
  'Denmark',        5.6,
  'China',          1386
)

data_to_plot <- data_summed_up %>%
  filter(
    country %in% c('Italy','France','Germany','Switzerland','United Kingdom','Netherlands','Denmark','China'),
    cases > 0
  ) %>%
  mutate(date = as.Date(as.character(date))) %>%
  left_join(population_sizes, by = 'country') %>%
  mutate(cases_per_million = cases / population_size)

p <- data_to_plot %>%
  ggplot(aes(date, cases_per_million, color = country)) +
  geom_point(alpha = 0.8, size = 1.5) +
  geom_line(linetype = 'dashed', show.legend = FALSE) +
  scale_x_date(breaks = scales::pretty_breaks(n = 10)) +
  scale_y_log10(
    name = 'Confirmed cases per million citizens',
    breaks = scales::trans_breaks('log10', function(x) 10^x),
    labels = scales::trans_format('log10', scales::math_format(10^.x))
  ) +
  annotation_logticks(sides ='l') +
  coord_cartesian(clip = 'off') +
  scale_color_tableau(name = '', guide = guide_legend(override.aes = list(size = 3))) +
  geom_text_repel(
    data = data_to_plot %>% filter(date == '2020-03-17'),
    aes(
      y = cases_per_million,
      label = paste0(country, ' (', format(cases, big.mark = ',', trim = TRUE), ')')
    ),
    x = as.Date('2020-03-17'), hjust = 0, direction = 'y', nudge_x = 4,
    xlim = as.Date(c("2020-01-22", "2020-04-15")),
  ) +
  theme_bw() +
  theme(
    legend.position = 'none',
    axis.title.x = element_blank(),
    panel.grid.major.x = element_blank(),
    panel.grid.minor.x = element_blank(),
    plot.margin = unit(c(5.5,150,5.5,5.5), 'pt')
  ) +
   annotation_custom(
    grob = rectGrob(gp = gpar(col = NA)),
    xmin = -100, xmax = min(data_to_plot$date),
    ymin = -100, ymax = log10(min(data_to_plot$cases_per_million))-0.1
  ) +
   annotation_custom(
    grob = rectGrob(gp = gpar(col = NA)),
    xmin = -100, xmax = min(data_to_plot$date),
    ymin = log10(max(data_to_plot$cases_per_million))+0.2, ymax = 1000
  )

ggsave('cases_per_million_citizens_with_labels.png', p, height = 4, width = 7)
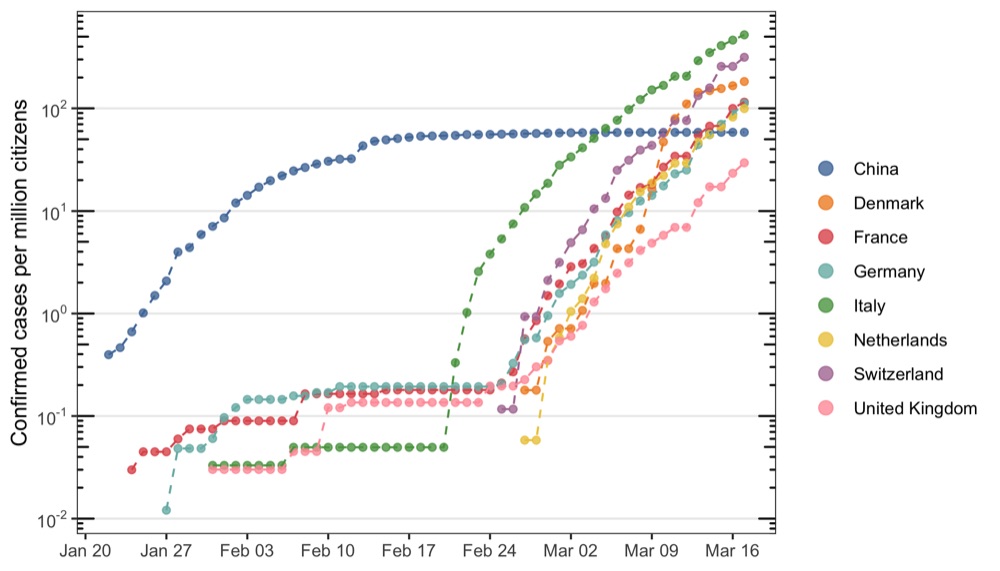
Without labels
library(tidyverse)
library(coronavirus)
library(ggrepel)
library(ggthemes)

population_sizes <- tribble(
  ~country,         ~population_size,
  'Italy',          60.48,
  'France',         66.89,
  'Germany',        82.79,
  'Switzerland',    8.57,
  'United Kingdom', 66.44,
  'Netherlands',    17.18,
  'Denmark',        5.6,
  'China',          1386
)

data_to_plot <- data_summed_up %>%
  filter(
    country %in% c('Italy','France','Germany','Switzerland','United Kingdom','Netherlands','Denmark','China'),
    cases > 0
  ) %>%
  mutate(date = as.Date(as.character(date))) %>%
  left_join(population_sizes, by = 'country') %>%
  mutate(cases_per_million = cases / population_size)

p <- ggplot(data_to_plot, aes(date, cases_per_million, color = country)) +
  geom_point(alpha = 0.8, size = 1.5) +
  geom_line(linetype = 'dashed', show.legend = FALSE) +
  scale_x_date(breaks = scales::pretty_breaks(n = 10)) +
  scale_y_log10(
    name = 'Confirmed cases per million citizens',
    breaks = scales::trans_breaks('log10', function(x) 10^x),
    labels = scales::trans_format('log10', scales::math_format(10^.x))
  ) +
  annotation_logticks(sides ='lr') +
  scale_color_tableau(name = '', guide = guide_legend(override.aes = list(size = 3))) +
  theme_bw() +
  theme(
    legend.position = 'right',
    axis.title.x = element_blank(),
    panel.grid.major.x = element_blank(),
    panel.grid.minor = element_blank()
  )

ggsave('cases_per_million_citizens.png', p, height = 4, width = 7)
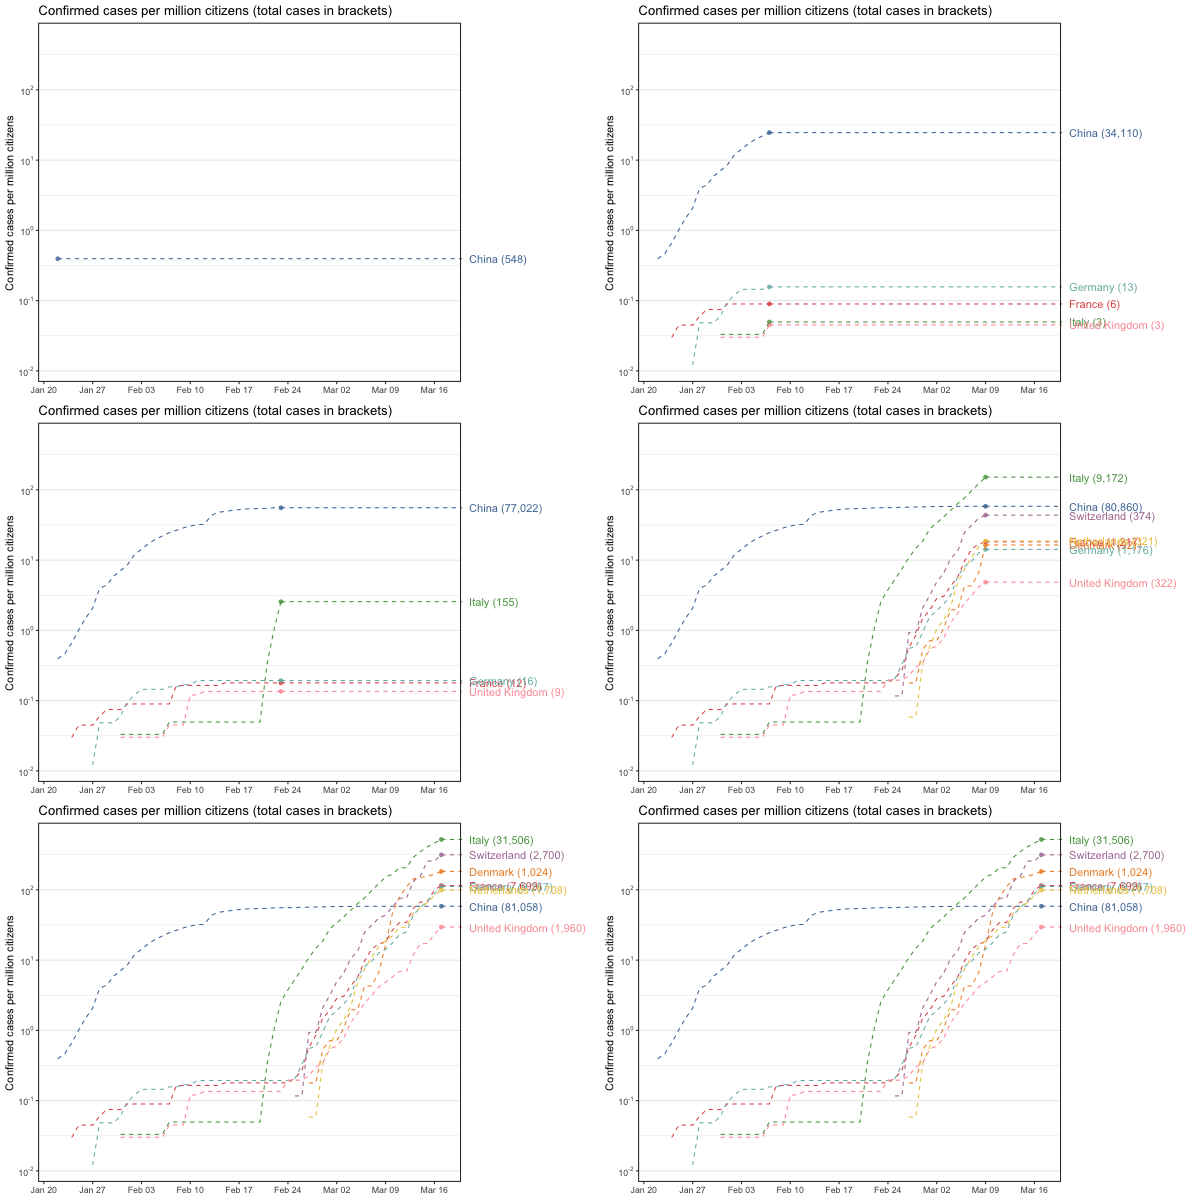
Animated
library(tidyverse)
library(coronavirus)
library(ggthemes)
library(gganimate)

population_sizes <- tribble(
  ~country,         ~population_size,
  'Italy',          60.48,
  'France',         66.89,
  'Germany',        82.79,
  'Switzerland',    8.57,
  'United Kingdom', 66.44,
  'Netherlands',    17.18,
  'Denmark',        5.6,
  'China',          1386
)

data_to_plot <- data_summed_up %>%
  filter(
    country %in% c('Italy','France','Germany','Switzerland','United Kingdom','Netherlands','Denmark','China'),
    cases > 0
  ) %>%
  mutate(date = as.Date(as.character(date))) %>%
  left_join(population_sizes, by = 'country') %>%
  mutate(cases_per_million = cases / population_size)

p <- data_to_plot %>%
  ggplot(aes(date, cases_per_million, color = country)) +
  geom_point(alpha = 0.8, size = 1.5) +
  geom_line(linetype = 'dashed', show.legend = FALSE) +
  geom_segment(
    aes(yend = cases_per_million), xend = as.Date('2020-03-20'), linetype = 2
  ) +
  geom_text(
    aes(label = paste0(country, ' (', format(cases, big.mark = ',', trim = TRUE), ')')),
    x = as.Date('2020-03-21'), hjust = 0
  ) +
  scale_x_date(breaks = scales::pretty_breaks(n = 10)) +
  scale_y_log10(
    name = 'Confirmed cases per million citizens',
    breaks = scales::trans_breaks('log10', function(x) 10^x),
    labels = scales::trans_format('log10', scales::math_format(10^.x))
  ) +
  coord_cartesian(clip = 'off') +
  scale_color_tableau(guide = guide_legend(override.aes = list(size = 3))) +
  labs(title = 'Confirmed cases per million citizens (total cases in brackets)') +
  theme_bw() +
  theme(
    legend.position = 'none',
    axis.title.x = element_blank(),
    panel.grid.major.x = element_blank(),
    panel.grid.minor.x = element_blank(),
    plot.margin = unit(c(5.5, 140, 5.5, 5.5), 'pt')
  ) +
  transition_reveal(date) +
  ease_aes('linear')

animation <- animate(p, height = 400, width = 600, end_pause = 30)
anim_save('cases_per_million_citizens_with_labels.gif', animation)
Interactive world map
For now, I made an animated world map showing the number of cases by country since 22.01.2020.
library(tidyverse)
library(coronavirus)
library(plotly)

## download country codes
country_codes <- read.csv('https://raw.githubusercontent.com/plotly/datasets/master/2014_world_gdp_with_codes.csv') %>%
  select(COUNTRY, CODE) %>%
  rename(country = COUNTRY) %>%
  mutate(
    country = as.character(country),
    country = ifelse(grepl(country, pattern = '^Korea, North$'), 'North Korea', country),
    country = ifelse(grepl(country, pattern = '^Korea, South$'), 'South Korea', country)
  )

## change some country names in the coronavirus data
coronavirus_tmp <- coronavirus %>%
  filter(type == 'confirmed') %>%
  rename(country = Country.Region) %>%
  select(date,country,cases) %>%
  mutate(
    country = ifelse(grepl(country, pattern = '^Mainland China$'), 'China', country),
    country = ifelse(grepl(country, pattern = '^North Macedonia$'), 'Macedonia', country),
    country = ifelse(grepl(country, pattern = '^US$'), 'United States', country),
    country = ifelse(grepl(country, pattern = '^UK$'), 'United Kingdom', country)
  )

## create vector of unique countries and dates
countries <- unique(country_codes$country) %>% sort()
dates <- unique(coronavirus_tmp$date) %>% sort()

## assign 0 cases to all countries without record
zero_cases <- tibble(
  country = countries,
  cases = 0
)

## skeleton for summed up data
data_summed_up <- tibble(
  date = character(),
  country = character(),
  code = character(),
  cases = numeric()
)

## for every recoded date, sum up the number of cases up until then
for ( i in seq(length(dates)) ) {
  temp_cases <- coronavirus_tmp %>%
    filter(date <= dates[i]) %>%
    bind_rows(zero_cases) %>%
    group_by(country) %>%
    summarize(cases = sum(cases)) %>%
    mutate(date = as.character(dates[i]))
  data_summed_up <- bind_rows(
    data_summed_up,
    temp_cases
  )
}

## create log-scaled version of cases for plotting (colors look better)
## and add country codes
data_summed_up <- data_summed_up %>%
  mutate(
    date = factor(date, levels = unique(date)),
    cases_log = log10(cases+1)
  ) %>%
  full_join(country_codes, by = 'country')

## create plot
p <- plot_geo(data_summed_up) %>%
  add_trace(
    z = ~cases_log,
    color = ~cases,
    colors = 'Blues',
    frame = ~date,
    hoverinfo = 'text',
    text = ~paste0(data_summed_up$country, ': ', format(data_summed_up$cases, trim = TRUE, big.mark = ',')),
    locations = ~CODE,
    marker = list(
      line = list(
        color = toRGB("grey"),
        width = 0.5
      )
    ),
    showscale = FALSE
  ) %>%
  layout(
    geo = list(
      showframe = FALSE,
      showcoastlines = FALSE,
      projection = list(type = 'winkel tripel')
    )
  )

htmlwidgets::saveWidget(p, 'world_map_animated.html')
Click the “Play” to start the animation or manually move the slider to see the date of interest.
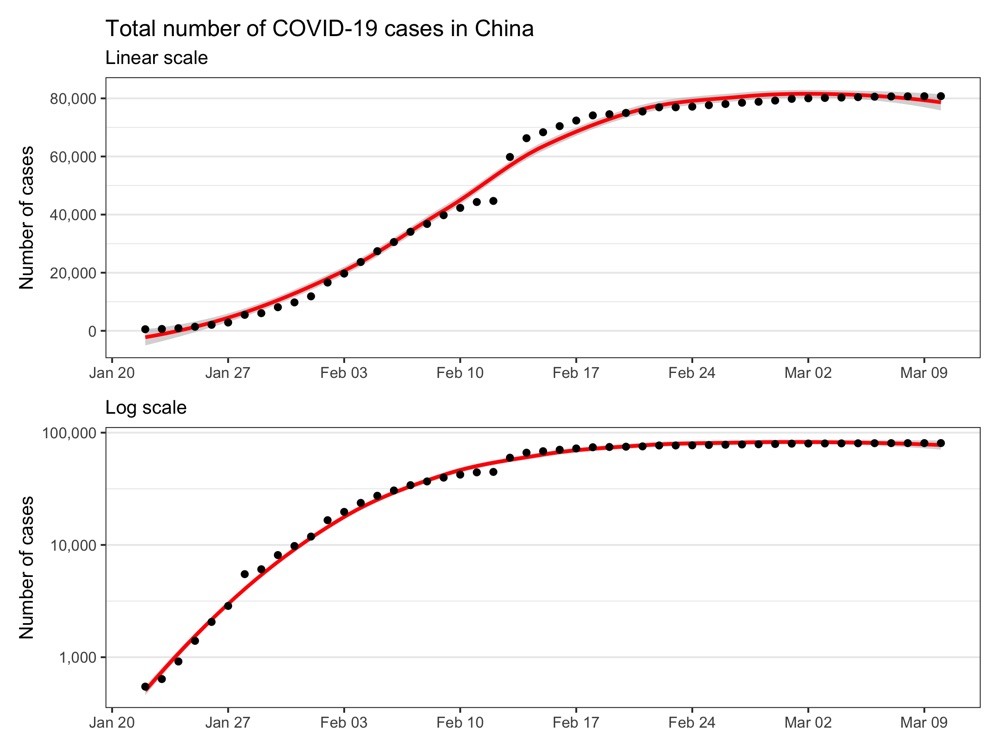
Confirmed cases in China
library(tidyverse)
library(coronavirus)
library(patchwork)

p1 <- coronavirus %>%
  filter(
    type == 'confirmed',
    grepl(Country.Region, pattern = 'China')
  ) %>%
  group_by(date) %>%
  summarize(cases = sum(cases)) %>%
  mutate(cases_sum = cumsum(cases)) %>%
  ggplot(aes(date, cases_sum)) +
  geom_smooth(method = 'loess', formula = 'y ~ x', color = 'red') +
  geom_point() +
  labs(title = 'Total number of COVID-19 cases in China', subtitle = 'Linear scale') +
  scale_x_date(breaks = scales::pretty_breaks(n = 10)) +
  scale_y_continuous(name = 'Number of cases', labels = scales::comma) +
  theme_bw() +
  theme(
    axis.title.x = element_blank(),
    panel.grid.major.x = element_blank(),
    panel.grid.minor.x = element_blank()
  )

p2 <- coronavirus %>%
  filter(
    type == 'confirmed',
    grepl(Country.Region, pattern = 'China')
  ) %>%
  group_by(date) %>%
  summarize(cases = sum(cases)) %>%
  mutate(cases_sum = cumsum(cases)) %>%
  ggplot(aes(date, cases_sum)) +
  geom_smooth(method = 'loess', formula = 'y ~ x', color = 'red') +
  geom_point() +
  labs(subtitle = 'Log scale') +
  scale_x_date(breaks = scales::pretty_breaks(n = 10)) +
  scale_y_log10(name = 'Number of cases', labels = scales::comma) +
  theme_bw() +
  theme(
    axis.title.x = element_blank(),
    panel.grid.major.x = element_blank(),
    panel.grid.minor.x = element_blank()
  )

ggsave('total_cases_china.png', p1 + p2 + plot_layout(ncol = 1), height = 6, width = 8)
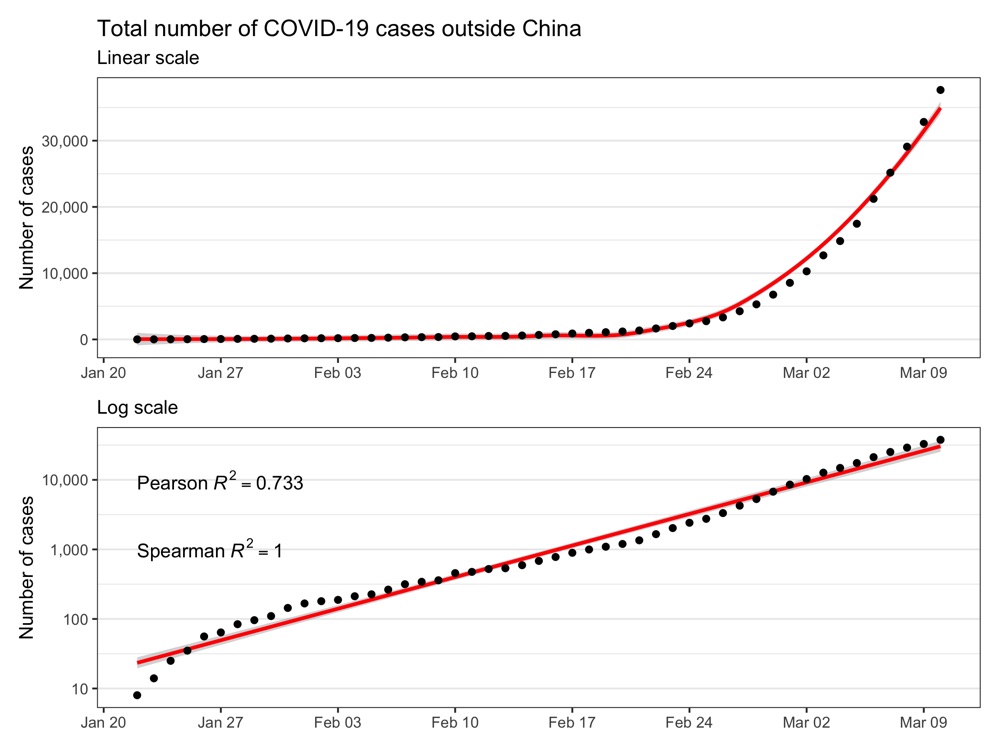
Confirmed cases outside of China
library(tidyverse)
library(coronavirus)
library(patchwork)

coronavirus_tmp <- coronavirus %>%
  filter(
    type == 'confirmed',
    grepl(Country.Region, pattern = 'China') == FALSE
  ) %>%
  rename(country = Country.Region) %>%
  select(date,cases) %>%
  group_by(date) %>%
  summarize(cases = sum(cases)) %>%
  mutate(cases_sum = cumsum(cases))

p1 <- ggplot(coronavirus_tmp, aes(date, cases_sum)) +
  geom_smooth(method = 'loess', formula = 'y ~ x', color = 'red') +
  geom_point() +
  labs(title = 'Total number of COVID-19 cases outside China', subtitle = 'Linear scale') +
  scale_x_date(breaks = scales::pretty_breaks(n = 10)) +
  scale_y_continuous(name = 'Number of cases', labels = scales::comma) +
  theme_bw() +
  theme(
    axis.title.x = element_blank(),
    panel.grid.major.x = element_blank(),
    panel.grid.minor.x = element_blank()
  )

correlation_pearson <- cor(as.numeric(coronavirus_tmp$date), coronavirus_tmp$cases_sum, method = 'pearson')
correlation_spearman <- cor(as.numeric(coronavirus_tmp$date), coronavirus_tmp$cases_sum, method = 'spearman')

label <- list(
  paste0('Pearson~italic(R)^2 == ', round(correlation_pearson, 3)),
  paste0('Spearman~italic(R)^2 == ', round(correlation_spearman, 3))
)

p2 <- ggplot(coronavirus_tmp, aes(date, cases_sum)) +
  geom_smooth(method = 'lm', formula = 'y ~ x', color = 'red') +
  geom_point() +
  labs(subtitle = 'Log scale') +
  scale_x_date(breaks = scales::pretty_breaks(n = 10)) +
  scale_y_log10(name = 'Number of cases', labels = scales::comma) +
  annotate('text', x = coronavirus_tmp$date[1], y = c(1E4, 1E3), hjust = 0, parse = TRUE, label = label) +
  theme_bw() +
  theme(
    axis.title.x = element_blank(),
    panel.grid.major.x = element_blank(),
    panel.grid.minor.x = element_blank()
  )

ggsave('total_cases_outside_china.png', p1 + p2 + plot_layout(ncol = 1), height = 6, width = 8)
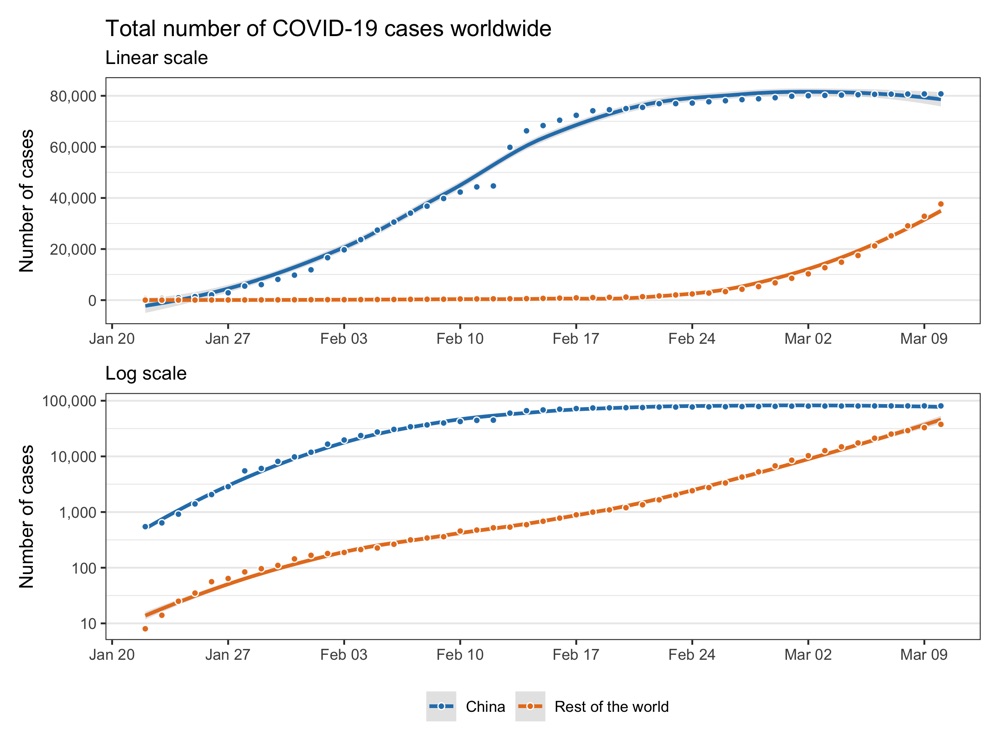
Confirmed cases worldwide
library(tidyverse)
library(coronavirus)
library(patchwork)

coronavirus_tmp <- coronavirus %>%
  filter(type == 'confirmed') %>%
  mutate(group = ifelse(grepl(Country.Region, pattern = 'China'), 'China', 'Rest of the world')) %>%
  group_by(group,date) %>%
  summarize(cases = sum(cases)) %>%
  mutate(cases_sum = cumsum(cases))

colors_here <- c('#2980b9', '#e67e22')

p1 <- ggplot(coronavirus_tmp, aes(date, cases_sum, fill = group, color = group, group = group)) +
  geom_smooth(fill = 'grey', method = 'loess', formula = 'y ~ x') +
  geom_point(color = 'white', shape = 21) +
  labs(title = 'Total number of COVID-19 cases worldwide', subtitle = 'Linear scale') +
  scale_x_date(breaks = scales::pretty_breaks(n = 10)) +
  scale_y_continuous(name = 'Number of cases', labels = scales::comma) +
  scale_color_manual(name = '', values = colors_here) +
  scale_fill_manual(name = '', values = colors_here) +
  theme_bw() +
  theme(
    legend.position = 'none',
    axis.title.x = element_blank(),
    panel.grid.major.x = element_blank(),
    panel.grid.minor.x = element_blank()
  )

p2 <- ggplot(coronavirus_tmp, aes(date, cases_sum, fill = group, color = group, group = group)) +
  geom_smooth(fill = 'grey', method = 'loess', formula = 'y ~ x') +
  geom_point(color = 'white', shape = 21) +
  labs(subtitle = 'Log scale') +
  scale_x_date(breaks = scales::pretty_breaks(n = 10)) +
  scale_y_log10(name = 'Number of cases', labels = scales::comma) +
  scale_color_manual(name = '', values = colors_here) +
  scale_fill_manual(name = '', values = colors_here) +
  theme_bw() +
  theme(
    legend.position = 'bottom',
    axis.title.x = element_blank(),
    panel.grid.major.x = element_blank(),
    panel.grid.minor.x = element_blank()
  )

ggsave('total_cases_china_and_rest.png', p1 + p2 + plot_layout(ncol = 1), height = 6, width = 8)
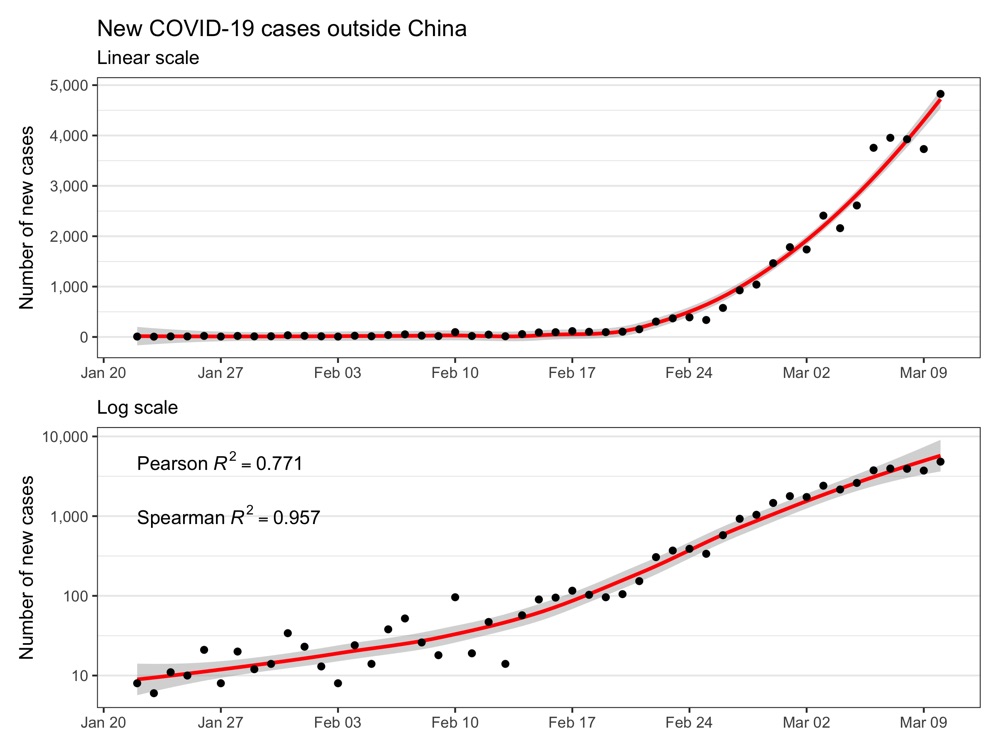
New cases outside of China
library(tidyverse)
library(coronavirus)
library(patchwork)

coronavirus_tmp <- coronavirus %>%
  filter(
    type == 'confirmed',
    grepl(Country.Region, pattern = 'China') == FALSE
  ) %>%
  group_by(date) %>%
  summarize(cases = sum(cases))

p1 <- ggplot(coronavirus_tmp, aes(date, cases)) +
  geom_smooth(method = 'loess', formula = 'y ~ x', color = 'red') +
  geom_point() +
  labs(title = 'New COVID-19 cases outside China', subtitle = 'Linear scale') +
  scale_x_date(breaks = scales::pretty_breaks(n = 10)) +
  scale_y_continuous(name = 'Number of new cases', labels = scales::comma) +
  theme_bw() +
  theme(
    axis.title.x = element_blank(),
    panel.grid.major.x = element_blank(),
    panel.grid.minor.x = element_blank()
  )

correlation_pearson <- cor(as.numeric(coronavirus_tmp$date), coronavirus_tmp$cases, method = 'pearson')
correlation_spearman <- cor(as.numeric(coronavirus_tmp$date), coronavirus_tmp$cases, method = 'spearman')

label <- list(
  paste0('Pearson~italic(R)^2 == ', round(correlation_pearson, 3)),
  paste0('Spearman~italic(R)^2 == ', round(correlation_spearman, 3))
)

p2 <- ggplot(coronavirus_tmp, aes(date, cases)) +
  geom_smooth(method = 'loess', formula = 'y ~ x', color = 'red') +
  geom_point() +
  labs(subtitle = 'Log scale') +
  scale_x_date(breaks = scales::pretty_breaks(n = 10)) +
  scale_y_log10(name = 'Number of new cases', labels = scales::comma) +
  annotate('text', x = coronavirus_tmp$date[1], y = c(5E3, 1E3), hjust = 0, parse = TRUE, label = label) +
  theme_bw() +
  theme(
    axis.title.x = element_blank(),
    panel.grid.major.x = element_blank(),
    panel.grid.minor.x = element_blank()
  )

ggsave('new_cases_outside_china.png', p1 + p2 + plot_layout(ncol = 1), height = 6, width = 8)
