Benchmark of scRNA-seq analysis tools
At the end of last year, I was curious to compare the results of a few single cell RNA-seq analysis tools, focusing on the generation of the transcript count matrix from the raw FASTQ files. The contenders are: 10x Genomics Cell Ranger, STARsolo, Alevin (Salmon), and kallisto. Even though this was done a while ago, and updates of the tools possibly influence the results, I thought it might be worth sharing anyway.
Preparation
Download raw data
I only used a single data set, which consists of roughly 11,000 cells from a human PBMC sample, was generated using the 10x Genomics Single Cell Gene Expression kit (v3 chemistry), and can be downloaded from the 10x Genomics website.
The data set contains 639 million reads, resulting in a sequencing depth of approximately 54,000 reads per cell.
mkdir -p <project_home>/raw_data/pbmc_10k_v3
cd <project_home>/raw_data/pbmc_10k_v3/
wget http://s3-us-west-2.amazonaws.com/10x.files/samples/cell-exp/3.0.0/pbmc_10k_v3/pbmc_10k_v3_fastqs.tar
tar -xf pbmc_10k_v3_fastqs.tar
mv pbmc_10k_v3_fastqs FASTQ
Collect reference
All reference files (genome as FASTA, transcriptome as FASTA, and annotation as GTF) were taken from GENCODE (v32).
Genome
We use the hg38 release of the human genome.
mkdir -p <project_home>/reference_files/hg38
cd <project_home>/reference_files/hg38
wget ftp://ftp.ebi.ac.uk/pub/databases/gencode/Gencode_human/release_32/GRCh38.primary_assembly.genome.fa.gz
gunzip GRCh38.primary_assembly.genome.fa.gz
Transcriptome
We use all transcripts.
cd <project_home>/reference_files/hg38
wget ftp://ftp.ebi.ac.uk/pub/databases/gencode/Gencode_human/release_32/gencode.v32.transcripts.fa.gz
gunzip gencode.v32.transcripts.fa.gz

grep -c '^>ENST' gencode.v32.transcripts.fa
# 227,462

# list of transcripts
cut -f1 gencode.v32.annotation_tgMap.tsv > gencode.v32.annotation_transcripts.tsv
Annotation
We use the comprehensive annotation.
cd <project_home>/reference_files/hg38
wget ftp://ftp.ebi.ac.uk/pub/databases/gencode/Gencode_human/release_32/gencode.v32.annotation.gtf.gz
gunzip gencode.v32.annotation.gtf.gz
Transcript to gene map file for Salmon
Alevin annd kallisto require a TSV file that connect every annotated transcript to its corresponding gene ID.
We can generate this file from the previously downloaded GTF file containing the comprehensive GENCODE annotation.
setwd('<project_home>/')

library(tidyverse)

gtf <- rtracklayer::import('reference_files/hg38/gencode.v32.annotation.gtf')

tgMap <- gtf %>%
  as_tibble() %>%
  select(transcript_id,gene_id) %>%
  filter(
    !is.na(transcript_id),
    !is.na(gene_id)
  ) %>%
  distinct()

write_tsv(tgMap, 'reference_files/hg38/gencode.v32.annotation_tgMap.tsv', col_names = FALSE)
List of cellular barcodes of 10x v3 kit
For some steps of the analysis, we will need a list of all valid cellular barcodes in the 10x Genomics Single Cell Gene Expression kit (v3 chemistry).
It’s well hidden but can be found in the Cell Ranger pipeline installation (cellranger-x.y.z/cellranger-cs/x.y.z/lib/python/cellranger/barcodes/3M-february-2018.txt.gz).
I previously extracted this file and unpacked it, so here I just take it from there.
cd <project_home>/
mkdir <project_home>/software
cp <some_other_folder>/3M-february-2018.txt <project_home>/software
Get tools
I have created separate Docker containers with Cell Ranger, STARsolo, Alevin (Salmon), and kallisto installed which I import into Singularity.
Cell Ranger
We use Cell Ranger 3.1.0.
singularity build <project_home>/software/cell_ranger_3.1.0.simg docker://romanhaa/cell_ranger:3.1.0
STARsolo
We use STAR 2.7.3a.
singularity build <project_home>/software/star_2.7.3a.simg docker://romanhaa/star:2.7.3a
Alevin (Salmon)
We use Alevin 0.14.1.
singularity build <project_home>/software/salmon_0.14.1.simg docker://combinelab/salmon:0.14.1
kallisto
We use kallisto 0.46.0.
singularity build <project_home>/software/kallist_0.46.0.simg docker://romanhaa/kallisto:0.46.0
Create indices
Cell Ranger
cd <project_home>/reference_files/hg38

singularity exec --bind /hpcnfs <project_home>/software/cell_ranger_3.1.0.simg \
cellranger mkref \
--genome=cell_ranger_3.1.0 \
--fasta=GRCh38.primary_assembly.genome.fa \
--genes=gencode.v32.annotation.gtf \
--nthreads=10 \
--memgb=8
# /cellranger-3.1.0/cellranger-cs/3.1.0/bin
# cellranger mkref (3.1.0)
# Copyright (c) 2019 10x Genomics, Inc.  All rights reserved.
# -------------------------------------------------------------------------------

# Creating new reference folder at <project_home>/cell_ranger_3.1.0
# ...done

# Writing genome FASTA file into reference folder...
# ...done

# Computing hash of genome FASTA file...
# ...done

# Indexing genome FASTA file...
# ...done

# Writing genes GTF file into reference folder...
# ...done

# Computing hash of genes GTF file...
# ...done

# Writing genes index file into reference folder (may take over 10 minutes for a 3Gb genome)...
# ...done

# Writing genome metadata JSON file into reference folder...
# ...done

# Generating STAR genome index (may take over 8 core hours for a 3Gb genome)...
# Oct 26 13:33:36 ..... Started STAR run
# Oct 26 13:33:37 ... Starting to generate Genome files
# Oct 26 13:35:25 ... starting to sort  Suffix Array. This may take a long time...
# Oct 26 13:35:29 ... sorting Suffix Array chunks and saving them to disk...
# Oct 26 13:36:11 ... loading chunks from disk, packing SA...
# Oct 26 13:36:43 ... Finished generating suffix array
# Oct 26 13:36:43 ... Generating Suffix Array index
# Oct 26 13:37:23 ... Completed Suffix Array index
# Oct 26 13:37:23 ..... Processing annotations GTF
# Oct 26 13:37:53 ..... Inserting junctions into the genome indices
# Oct 26 13:40:54 ... writing Genome to disk ...
# Oct 26 13:41:38 ... writing Suffix Array to disk ...
# Oct 26 13:41:54 ... writing SAindex to disk
# Oct 26 13:42:14 ..... Finished successfully
# ...done.

# >>> Reference successfully created! <<<

# You can now specify this reference on the command line:
# cellranger --transcriptome=<project_home>/reference_files/hg38/cell_ranger_3.1.0 ...
STARsolo
cd <project_home>/reference_files/hg38
mkdir STAR_2.7.3a

singularity exec --bind /hpcnfs <project_home>/software/star_2.7.3a.simg \
STAR \
--runThreadN 12 \
--runMode genomeGenerate \
--genomeDir STAR_2.7.3a \
--genomeFastaFiles GRCh38.primary_assembly.genome.fa \
--sjdbGTFfile gencode.v32.annotation.gtf \
--sjdbGTFtagExonParentGene gene_id \
--sjdbOverhang 90
# Oct 26 13:16:56 ..... started STAR run
# Oct 26 13:16:56 ... starting to generate Genome files
# Oct 26 13:18:01 ... starting to sort Suffix Array. This may take a long time...
# Oct 26 13:18:17 ... sorting Suffix Array chunks and saving them to disk...
# Oct 26 13:46:47 ... loading chunks from disk, packing SA...
# Oct 26 13:56:06 ... finished generating suffix array
# Oct 26 13:56:06 ... generating Suffix Array index
# Oct 26 14:00:04 ... completed Suffix Array index
# Oct 26 14:00:04 ..... processing annotations GTF
# Oct 26 14:00:32 ..... inserting junctions into the genome indices
# Oct 26 14:03:41 ... writing Genome to disk ...
# Oct 26 14:04:10 ... writing Suffix Array to disk ...
# Oct 26 14:07:46 ... writing SAindex to disk
# Oct 26 14:08:02 ..... finished successfully
Alevin (Salmon)
cd <project_home>
mkdir reference_files/hg38/salmon_index_k_31

singularity exec --bind /hpcnfs <project_home>/software/salmon_0.14.1.simg \
salmon index \
--transcripts reference_files/hg38/gencode.v32.transcripts.fa \
--gencode \
--index reference_files/hg38/salmon_index_k_31 \
--kmerLen 31
# Version Info: Could not resolve upgrade information in the alotted time.
# Check for upgrades manually at https://combine-lab.github.io/salmon
# index ["reference_files/hg38/salmon_index_k_31"] did not previously exist  . . . creating it
# [2019-10-24 09:48:46.039] [jLog] [info] building index
# [2019-10-24 09:48:46.043] [jointLog] [info] [Step 1 of 4] : counting k-mers
# [2019-10-24 09:48:48.050] [jointLog] [warning] Entry with header [ENST00000473810.1|ENSG00000239255.1|OTTHUMG00000157482.1|OTTHUMT00000348942.1|AC007620.1-201|AC007620.1|25|processed_pseudogene|], had length less than the k-mer length of 31 (perhaps after poly-A clipping)
# [2019-10-24 09:48:48.178] [jointLog] [warning] Entry with header [ENST00000603775.1|ENSG00000271544.1|OTTHUMG00000184300.1|OTTHUMT00000468575.1|AC006499.8-201|AC006499.8|23|processed_pseudogene|], had length less than the k-mer length of 31 (perhaps after poly-A clipping)
# [2019-10-24 09:48:49.680] [jointLog] [warning] Entry with header [ENST00000632684.1|ENSG00000282431.1|OTTHUMG00000190602.2|OTTHUMT00000485301.2|TRBD1-202|TRBD1|12|TR_D_gene|], had length less than the k-mer length of 31 (perhaps after poly-A clipping)
# [2019-10-24 09:48:51.483] [jointLog] [warning] Entry with header [ENST00000626826.1|ENSG00000281344.1|OTTHUMG00000189570.1|OTTHUMT00000479989.1|HELLPAR-201|HELLPAR|205012|lncRNA|] was longer than 200000 nucleotides.  Are you certain that we are indexing a transcriptome and not a genome?
# [2019-10-24 09:48:51.558] [jointLog] [warning] Entry with header [ENST00000543745.1|ENSG00000255972.1|OTTHUMG00000168883.1|OTTHUMT00000401485.1|AC026333.1-201|AC026333.1|28|processed_pseudogene|], had length less than the k-mer length of 31 (perhaps after poly-A clipping)
# [2019-10-24 09:48:51.777] [jointLog] [warning] Entry with header [ENST00000415118.1|ENSG00000223997.1|OTTHUMG00000170844.2|OTTHUMT00000410670.2|TRDD1-201|TRDD1|8|TR_D_gene|], had length less than the k-mer length of 31 (perhaps after poly-A clipping)
# [2019-10-24 09:48:51.777] [jointLog] [warning] Entry with header [ENST00000434970.2|ENSG00000237235.2|OTTHUMG00000170845.2|OTTHUMT00000410671.2|TRDD2-201|TRDD2|9|TR_D_gene|], had length less than the k-mer length of 31 (perhaps after poly-A clipping)
# [2019-10-24 09:48:51.777] [jointLog] [warning] Entry with header [ENST00000448914.1|ENSG00000228985.1|OTTHUMG00000170846.2|OTTHUMT00000410672.2|TRDD3-201|TRDD3|13|TR_D_gene|], had length less than the k-mer length of 31 (perhaps after poly-A clipping)
# [2019-10-24 09:48:52.027] [jointLog] [warning] Entry with header [ENST00000439842.1|ENSG00000236597.1|OTTHUMG00000152435.2|OTTHUMT00000326213.2|IGHD7-27-201|IGHD7-27|11|IG_D_gene|], had length less than the k-mer length of 31 (perhaps after poly-A clipping)
# [2019-10-24 09:48:52.027] [jointLog] [warning] Entry with header [ENST00000390567.1|ENSG00000211907.1|OTTHUMG00000152429.2|OTTHUMT00000326207.2|IGHD1-26-201|IGHD1-26|20|IG_D_gene|], had length less than the k-mer length of 31 (perhaps after poly-A clipping)
# [2019-10-24 09:48:52.027] [jointLog] [warning] Entry with header [ENST00000452198.1|ENSG00000225825.1|OTTHUMG00000152436.2|OTTHUMT00000326214.2|IGHD6-25-201|IGHD6-25|18|IG_D_gene|], had length less than the k-mer length of 31 (perhaps after poly-A clipping)
# [2019-10-24 09:48:52.027] [jointLog] [warning] Entry with header [ENST00000390569.1|ENSG00000211909.1|OTTHUMG00000152427.2|OTTHUMT00000326205.2|IGHD5-24-201|IGHD5-24|20|IG_D_gene|], had length less than the k-mer length of 31 (perhaps after poly-A clipping)
# [2019-10-24 09:48:52.027] [jointLog] [warning] Entry with header [ENST00000437320.1|ENSG00000227196.1|OTTHUMG00000152438.2|OTTHUMT00000326216.2|IGHD4-23-201|IGHD4-23|19|IG_D_gene|], had length less than the k-mer length of 31 (perhaps after poly-A clipping)
# [2019-10-24 09:48:52.027] [jointLog] [warning] Entry with header [ENST00000390572.1|ENSG00000211912.1|OTTHUMG00000152428.2|OTTHUMT00000326206.2|IGHD2-21-201|IGHD2-21|28|IG_D_gene|], had length less than the k-mer length of 31 (perhaps after poly-A clipping)
# [2019-10-24 09:48:52.028] [jointLog] [warning] Entry with header [ENST00000450276.1|ENSG00000237020.1|OTTHUMG00000152432.2|OTTHUMT00000326210.2|IGHD1-20-201|IGHD1-20|17|IG_D_gene|], had length less than the k-mer length of 31 (perhaps after poly-A clipping)
# [2019-10-24 09:48:52.028] [jointLog] [warning] Entry with header [ENST00000390574.1|ENSG00000211914.1|OTTHUMG00000152431.2|OTTHUMT00000326209.2|IGHD6-19-201|IGHD6-19|21|IG_D_gene|], had length less than the k-mer length of 31 (perhaps after poly-A clipping)
# [2019-10-24 09:48:52.028] [jointLog] [warning] Entry with header [ENST00000390575.1|ENSG00000211915.1|OTTHUMG00000152433.2|OTTHUMT00000326211.2|IGHD5-18-201|IGHD5-18|20|IG_D_gene|], had length less than the k-mer length of 31 (perhaps after poly-A clipping)
# [2019-10-24 09:48:52.028] [jointLog] [warning] Entry with header [ENST00000431870.1|ENSG00000227800.1|OTTHUMG00000152437.2|OTTHUMT00000326215.2|IGHD4-17-201|IGHD4-17|16|IG_D_gene|], had length less than the k-mer length of 31 (perhaps after poly-A clipping)
# [2019-10-24 09:48:52.028] [jointLog] [warning] Entry with header [ENST00000451044.1|ENSG00000227108.1|OTTHUMG00000152369.2|OTTHUMT00000326003.2|IGHD1-14-201|IGHD1-14|17|IG_D_gene|], had length less than the k-mer length of 31 (perhaps after poly-A clipping)
# [2019-10-24 09:48:52.028] [jointLog] [warning] Entry with header [ENST00000390580.1|ENSG00000211920.1|OTTHUMG00000152370.2|OTTHUMT00000326004.2|IGHD6-13-201|IGHD6-13|21|IG_D_gene|], had length less than the k-mer length of 31 (perhaps after poly-A clipping)
# [2019-10-24 09:48:52.028] [jointLog] [warning] Entry with header [ENST00000390581.1|ENSG00000211921.1|OTTHUMG00000152367.2|OTTHUMT00000326001.2|IGHD5-12-201|IGHD5-12|23|IG_D_gene|], had length less than the k-mer length of 31 (perhaps after poly-A clipping)
# [2019-10-24 09:48:52.028] [jointLog] [warning] Entry with header [ENST00000431440.2|ENSG00000232543.2|OTTHUMG00000152368.2|OTTHUMT00000326002.2|IGHD4-11-201|IGHD4-11|16|IG_D_gene|], had length less than the k-mer length of 31 (perhaps after poly-A clipping)
# [2019-10-24 09:48:52.028] [jointLog] [warning] Entry with header [ENST00000430425.1|ENSG00000237197.1|OTTHUMG00000152357.2|OTTHUMT00000325963.2|IGHD1-7-201|IGHD1-7|17|IG_D_gene|], had length less than the k-mer length of 31 (perhaps after poly-A clipping)
# [2019-10-24 09:48:52.028] [jointLog] [warning] Entry with header [ENST00000454691.1|ENSG00000228131.1|OTTHUMG00000152353.2|OTTHUMT00000325959.2|IGHD6-6-201|IGHD6-6|18|IG_D_gene|], had length less than the k-mer length of 31 (perhaps after poly-A clipping)
# [2019-10-24 09:48:52.028] [jointLog] [warning] Entry with header [ENST00000390588.1|ENSG00000211928.1|OTTHUMG00000152360.2|OTTHUMT00000325966.2|IGHD5-5-201|IGHD5-5|20|IG_D_gene|], had length less than the k-mer length of 31 (perhaps after poly-A clipping)
# [2019-10-24 09:48:52.028] [jointLog] [warning] Entry with header [ENST00000414852.1|ENSG00000233655.1|OTTHUMG00000152355.2|OTTHUMT00000325961.2|IGHD4-4-201|IGHD4-4|16|IG_D_gene|], had length less than the k-mer length of 31 (perhaps after poly-A clipping)
# [2019-10-24 09:48:52.028] [jointLog] [warning] Entry with header [ENST00000454908.1|ENSG00000236170.1|OTTHUMG00000152359.2|OTTHUMT00000325965.2|IGHD1-1-201|IGHD1-1|17|IG_D_gene|], had length less than the k-mer length of 31 (perhaps after poly-A clipping)
# [2019-10-24 09:48:52.029] [jointLog] [warning] Entry with header [ENST00000518246.1|ENSG00000254045.1|OTTHUMG00000152060.1|OTTHUMT00000325154.1|IGHVIII-22-2-201|IGHVIII-22-2|28|IG_V_pseudogene|], had length less than the k-mer length of 31 (perhaps after poly-A clipping)
# [2019-10-24 09:48:52.030] [jointLog] [warning] Entry with header [ENST00000604642.1|ENSG00000270961.1|OTTHUMG00000184622.2|OTTHUMT00000468982.2|IGHD5OR15-5A-201|IGHD5OR15-5A|23|IG_D_gene|], had length less than the k-mer length of 31 (perhaps after poly-A clipping)
# [2019-10-24 09:48:52.030] [jointLog] [warning] Entry with header [ENST00000603326.1|ENSG00000271317.1|OTTHUMG00000184621.3|OTTHUMT00000468981.3|IGHD4OR15-4A-201|IGHD4OR15-4A|19|IG_D_gene|], had length less than the k-mer length of 31 (perhaps after poly-A clipping)
# [2019-10-24 09:48:52.030] [jointLog] [warning] Entry with header [ENST00000605284.1|ENSG00000271336.1|OTTHUMG00000184580.2|OTTHUMT00000468908.2|IGHD1OR15-1A-201|IGHD1OR15-1A|17|IG_D_gene|], had length less than the k-mer length of 31 (perhaps after poly-A clipping)
# [2019-10-24 09:48:52.033] [jointLog] [warning] Entry with header [ENST00000604446.1|ENSG00000270824.1|OTTHUMG00000184624.2|OTTHUMT00000468984.2|IGHD5OR15-5B-201|IGHD5OR15-5B|23|IG_D_gene|], had length less than the k-mer length of 31 (perhaps after poly-A clipping)
# [2019-10-24 09:48:52.042] [jointLog] [warning] Entry with header [ENST00000603693.1|ENSG00000270451.1|OTTHUMG00000184611.3|OTTHUMT00000468945.3|IGHD4OR15-4B-201|IGHD4OR15-4B|19|IG_D_gene|], had length less than the k-mer length of 31 (perhaps after poly-A clipping)
# [2019-10-24 09:48:52.042] [jointLog] [warning] Entry with header [ENST00000604838.1|ENSG00000270185.1|OTTHUMG00000184585.2|OTTHUMT00000468915.2|IGHD1OR15-1B-201|IGHD1OR15-1B|17|IG_D_gene|], had length less than the k-mer length of 31 (perhaps after poly-A clipping)
# [2019-10-24 09:48:52.837] [jointLog] [warning] Entry with header [ENST00000579054.1|ENSG00000266416.1|OTTHUMG00000179204.1|OTTHUMT00000445280.1|AC130289.2-201|AC130289.2|28|processed_pseudogene|], had length less than the k-mer length of 31 (perhaps after poly-A clipping)
# [2019-10-24 09:48:53.480] [jointLog] [warning] Entry with header [ENST00000634174.1|ENSG00000282732.1|OTTHUMG00000191398.1|OTTHUMT00000487783.1|AC073539.7-201|AC073539.7|28|unprocessed_pseudogene|], had length less than the k-mer length of 31 (perhaps after poly-A clipping)
# Elapsed time: 8.59662s
# [2019-10-24 09:48:54.640] [jointLog] [warning] Removed 854 transcripts that were sequence duplicates of indexed transcripts.
# [2019-10-24 09:48:54.640] [jointLog] [warning] If you wish to retain duplicate transcripts, please use the `--keepDuplicates` flag
# [2019-10-24 09:48:54.657] [jointLog] [info] Replaced 4 non-ATCG nucleotides
# [2019-10-24 09:48:54.657] [jointLog] [info] Clipped poly-A tails from 1814 transcripts
# [2019-10-24 09:48:54.671] [jointLog] [info] Building rank-select dictionary and saving to disk
# [2019-10-24 09:48:54.695] [jointLog] [info] done
# Elapsed time: 0.0236391s
# [2019-10-24 09:48:55.111] [jointLog] [info] Writing sequence data to file . . .
# [2019-10-24 09:48:55.329] [jointLog] [info] done
# Elapsed time: 0.218913s
# [2019-10-24 09:48:58.504] [jointLog] [info] Building 32-bit suffix array (length of generalized text is 356944333)
# [2019-10-24 09:48:58.943] [jointLog] [info] Building suffix array . . .
# success
# saving to disk . . . done
# Elapsed time: 0.843981s
# done
# Elapsed time: 44.8151s
# processed 356000000 positions[2019-10-24 09:52:10.475] [jointLog] [info] khash had 143394783 keys
# [2019-10-24 09:52:10.479] [jointLog] [info] saving hash to disk . . .
# [2019-10-24 09:52:19.074] [jointLog] [info] done
# Elapsed time: 8.59516s
# [2019-10-24 09:52:40.740] [jLog] [info] done building index
kallisto
singularity exec --bind /hpcnfs \
software/kallisto_0.46.0.simg \
kallisto index \
--index reference_files/hg38/kallisto_index_k_31 \
--kmer-size 31 \
reference_files/hg38/gencode.v32.transcripts.fa
# [build] loading fasta file reference_files/hg38/gencode.v32.transcripts.fa
# [build] k-mer length: 31
# [build] warning: clipped off poly-A tail (longer than 10)
#         from 1814 target sequences
# [build] warning: replaced 4 non-ACGUT characters in the input sequence
#         with pseudorandom nucleotides
# [build] counting k-mers ... done.
# [build] building target de Bruijn graph ...  done
# [build] creating equivalence classes ...  done
# [build] target de Bruijn graph has 1472677 contigs and contains 140115246 k-mers
NOTE: Similar to Alevin, this step took about 5 minutes to finish.
Quantify gene expression
Every tool has its own way of operation, which means that Alevin needs to be run multiple times in order to generate output that can be compared with the other tools.
Each job will be run on a single node of our HPC, with 20 threads/cores and 128GB of memory available. No other jobs compete for the same memory.
Cell Ranger
Cell Ranger outputs both the raw and a filtered matrix of transcript counts. The filtered matrix contains only those cellular barcodes that have been identified as belonging to actual cells, whereas the others are background and therefore removed.
Cell Ranger might not be the best tool for the analysis out there, but since it is provided by 10x Genomics, the manufacturer of the library preparation kit, we will use the list of cells identified by it, also known as whitelist, to compare the tools.
Here is the script that was submitted to the job scheduler.
#PBS -N cell_ranger
#PBS -l select=1:ncpus=28:mem=120gb
#PBS -o <..>/sh_files/cell_ranger.stdout
#PBS -e <..>/sh_files/cell_ranger.stderr
#PBS -m ae
#PBS -M roman.hillje@ieo.it

mkdir <project_home>/results/pbmc_10k_v3/cell_ranger
cd <project_home>/results/pbmc_10k_v3/cell_ranger

singularity \
exec --bind /hpcnfs \
<project_home>/software/cell_ranger_3.1.0.simg \
cellranger count \
--id=pbmc_10k_v3 \
--transcriptome=<project_home>/reference_files/hg38/cell_ranger_3.1.0 \
--fastqs=<project_home>/raw_data/pbmc_10k_v3/FASTQ \
--sample=pbmc_10k_v3 \
--expect-cells=10000 \
--jobmode=local \
--localcores=20 \
--localmem=100 \
--mempercore=5
Below is a summary of the run time and used resources.
resources_used.cpupercent=1077
resources_used.cput=222:30:36
resources_used.mem=125829116kb
resources_used.ncpus=28
resources_used.vmem=125829120kb
resources_used.walltime=20:39:07
STARsolo
Also STAR automatically generates a raw and filtered transcript count matrix. The algorithm for cellular barcode filtering is one that was used in previous Cell Ranger versions.
Here is the script that was submitted to the job scheduler.
#PBS -N star
#PBS -l select=1:ncpus=28:mem=120gb
#PBS -o <project_home>/sh_files/star.stdout
#PBS -e <project_home>/sh_files/star.stderr
#PBS -m ae
#PBS -M roman.hillje@ieo.it

mkdir <project_home>/results/pbmc_10k_v3/STAR
cd <project_home>/results/pbmc_10k_v3/STAR

singularity \
exec --bind /hpcnfs \
<project_home>/software/star_2.7.3a.simg \
STAR \
--runThreadN 20 \
--genomeDir <project_home>/reference_files/hg38/STAR_2.7.3a \
--readFilesIn \
<project_home>/raw_data/pbmc_10k_v3/FASTQ/pbmc_10k_v3_S1_L001_R2_001.fastq.gz,<project_home>/raw_data/pbmc_10k_v3/FASTQ/pbmc_10k_v3_S1_L002_R2_001.fastq.gz \
<project_home>/raw_data/pbmc_10k_v3/FASTQ/pbmc_10k_v3_S1_L001_R1_001.fastq.gz,<project_home>/raw_data/pbmc_10k_v3/FASTQ/pbmc_10k_v3_S1_L002_R1_001.fastq.gz \
--readFilesCommand zcat \
--outFileNamePrefix ./ \
--outTmpKeep None \
--outStd Log \
--outSAMtype None \
--soloType CB_UMI_Simple \
--soloCBwhitelist <project_home>/software/3M-february-2018.txt \
--soloCBstart 1 \
--soloCBlen 16 \
--soloUMIstart 17 \
--soloUMIlen 12 \
--soloBarcodeReadLength 1 \
--soloCBmatchWLtype 1MM_multi_pseudocounts \
--soloStrand Forward \
--soloFeatures Gene \
--soloUMIdedup 1MM_All \
--soloUMIfiltering MultiGeneUMI \
--soloOutFileNames STARsolo/ features.tsv barcodes.tsv matrix.mtx \
--soloCellFilter CellRanger2.2 3000 0.99 10
Below is a summary of the run time and used resources.
resources_used.cpupercent=1584
resources_used.cput=09:10:46
resources_used.mem=45942620kb
resources_used.ncpus=28
resources_used.vmem=46475712kb
resources_used.walltime=00:34:45
Alevin (Salmon)
Unfortunately, at least at the time I performed this analysis, Alevin requires providing a list of cellular barcodes in order to run or otherwise it will apply its own filtering algorithm. That means, to compare the tools, we have to run it twice:
- With the entire list of valid barcodes to generate the raw transcript count matrix.
- Not providing any list and using the Alevin filtering algorithm.
With all cellular barcodes as whitelist file (raw)
Here is the script that was submitted to the job scheduler.
#PBS -N alevin_1
#PBS -l select=1:ncpus=28:mem=120gb
#PBS -o <project_home>/sh_files/alevin_1.stdout
#PBS -e <project_home>/sh_files/alevin_1.stderr
#PBS -m ae
#PBS -M roman.hillje@ieo.it

cd <project_home>

singularity exec \
--bind /hpcnfs \
software/salmon_0.14.1.simg \
salmon alevin \
--libType ISR \
--mates1 \
raw_data/pbmc_10k_v3/FASTQ/pbmc_10k_v3_S1_L001_R1_001.fastq.gz \
raw_data/pbmc_10k_v3/FASTQ/pbmc_10k_v3_S1_L002_R1_001.fastq.gz \
--mates2 \
raw_data/pbmc_10k_v3/FASTQ/pbmc_10k_v3_S1_L001_R2_001.fastq.gz \
raw_data/pbmc_10k_v3/FASTQ/pbmc_10k_v3_S1_L002_R2_001.fastq.gz \
--chromiumV3 \
--index reference_files/hg38/salmon_index_k_31 \
--threads 20 \
--dumpMtx \
--output results/pbmc_10k_v3/alevin/raw \
--whitelist software/3M-february-2018.txt \
--tgMap reference_files/hg38/gencode.v32.annotation_tgMap.tsv
Below is a summary of the run time and used resources.
resources_used.cpupercent=1898
resources_used.cput=53:05:08
resources_used.mem=21223076kb
resources_used.ncpus=28
resources_used.vmem=34565292kb
resources_used.walltime=03:09:25
Without specified whitelist file (filtered)
Here is the script that was submitted to the job scheduler.
#PBS -N alevin_2
#PBS -l select=1:ncpus=28:mem=120gb
#PBS -o <project_home>/sh_files/alevin_2.stdout
#PBS -e <project_home>/sh_files/alevin_2.stderr
#PBS -m ae
#PBS -M roman.hillje@ieo.it

cd <project_home>

singularity exec \
--bind /hpcnfs \
software/salmon_0.14.1.simg \
salmon alevin \
--libType ISR \
--mates1 \
raw_data/pbmc_10k_v3/FASTQ/pbmc_10k_v3_S1_L001_R1_001.fastq.gz \
raw_data/pbmc_10k_v3/FASTQ/pbmc_10k_v3_S1_L002_R1_001.fastq.gz \
--mates2 \
raw_data/pbmc_10k_v3/FASTQ/pbmc_10k_v3_S1_L001_R2_001.fastq.gz \
raw_data/pbmc_10k_v3/FASTQ/pbmc_10k_v3_S1_L002_R2_001.fastq.gz \
--chromiumV3 \
--index reference_files/hg38/salmon_index_k_31 \
--threads 20 \
--dumpMtx \
--output results/pbmc_10k_v3/alevin/filtered \
--tgMap reference_files/hg38/gencode.v32.annotation_tgMap.tsv
Below is a summary of the run time and used resources.
resources_used.cpupercent=1829
resources_used.cput=13:06:48
resources_used.mem=18361588kb
resources_used.ncpus=28
resources_used.vmem=33971372kb
resources_used.walltime=00:59:45
kallisto
kallisto does not have any integrated algorithm for cellular barcode filtering and expects you to provide a list of barcodes you want to analyze. We simply run kallisto once to quantify transcript counts in all valid cellular barcodes and then extract the cells identified by Cell Ranger later.
Here is the script that was submitted to the job scheduler.
#PBS -N kallisto
#PBS -l select=1:ncpus=28:mem=120gb
#PBS -o <project_home>/sh_files/kallisto.stdout
#PBS -e <project_home>/sh_files/kallisto.stderr
#PBS -m ae
#PBS -M roman.hillje@ieo.it

cd <project_home>

singularity \
exec --bind /hpcnfs \
software/kallisto_0.46.0.simg \
kallisto bus \
--index reference_files/hg38/kallisto_index_k_31 \
--output-dir results/pbmc_10k_v3/kallisto \
--technology 10xv3 \
--threads 20 \
raw_data/pbmc_10k_v3/FASTQ/pbmc_10k_v3_S1_L001_R1_001.fastq.gz raw_data/pbmc_10k_v3/FASTQ/pbmc_10k_v3_S1_L001_R2_001.fastq.gz \
raw_data/pbmc_10k_v3/FASTQ/pbmc_10k_v3_S1_L002_R1_001.fastq.gz raw_data/pbmc_10k_v3/FASTQ/pbmc_10k_v3_S1_L002_R2_001.fastq.gz

cd results/pbmc_10k_v3/kallisto
mkdir genecount/ tmp/

singularity \
exec --bind /hpcnfs \
<project_home>/software/kallisto_0.46.0.simg \
bustools correct \
--whitelist <project_home>/software/3M-february-2018.txt \
--pipe \
output.bus | \
singularity \
exec --bind /hpcnfs \
<project_home>/software/kallisto_0.46.0.simg \
bustools sort \
--temp tmp/ \
--threads 20 \
--pipe \
- | \
singularity \
exec --bind /hpcnfs \
<project_home>/software/kallisto_0.46.0.simg \
bustools count \
--output genecount/genes \
--genemap <project_home>/reference_files/hg38/gencode.v32.annotation_tgMap.tsv \
--ecmap matrix.ec \
--txnames <project_home>/reference_files/hg38/gencode.v32.annotation_transcripts.tsv \
--genecounts \
-
Below is a summary of the run time and used resources.
resources_used.cpupercent=404
resources_used.cput=01:54:21
resources_used.mem=13737072kb
resources_used.ncpus=28
resources_used.vmem=14877188kb
resources_used.walltime=00:35:09
Compare results
After producing all the transcript count matrices, it is time for some comparisons.
Load data
First, we prepare an object that will hold all the transcript counts.
library(tidyverse)

feature_matrix <- list()
Now, we can load and add the matrices one-by-one. Importantly, for each raw transcript count matrix, we also (1) remove all genes that are not expressed in any cell and (2) cellular barcodes without any transcript in any gene (0 transcripts in total). Instead, in the filtered matrices, we only remove the genes that are not expressed in any cell but leave the cellular barcodes as they are.
Cell Ranger
All cellular barcodes
temp <- Matrix::readMM("results/pbmc_10k_v3/cell_ranger/pbmc_10k_v3/outs/raw_feature_bc_matrix/matrix.mtx.gz")
colnames(temp) <- readr::read_tsv("results/pbmc_10k_v3/cell_ranger/pbmc_10k_v3/outs/raw_feature_bc_matrix/barcodes.tsv.gz", col_names = FALSE) %>%
  dplyr::select(1) %>%
  t() %>%
  as.vector() %>%
  gsub(pattern = '-1', replacement = '')
rownames(temp) <- readr::read_tsv("results/pbmc_10k_v3/cell_ranger/pbmc_10k_v3/outs/raw_feature_bc_matrix/features.tsv.gz", col_names = FALSE) %>%
  dplyr::select(1) %>%
  t() %>%
  as.vector()

any(duplicated(rownames(temp)))
# FALSE

## remove non-expressed genes
expressed_genes <- Matrix::rowSums(temp)
expressed_genes <- which(expressed_genes > 0)
temp <- temp[expressed_genes,]

## remove empty cells
empty_cells <- Matrix::colSums(temp)
empty_cells <- which(empty_cells == 0)
temp <- temp[,-empty_cells]

feature_matrix$cell_ranger_all_barcodes <- temp
Filtered cellular barcodes
temp <- Matrix::readMM("results/pbmc_10k_v3/cell_ranger/pbmc_10k_v3/outs/filtered_feature_bc_matrix/matrix.mtx.gz")
colnames(temp) <- readr::read_tsv("results/pbmc_10k_v3/cell_ranger/pbmc_10k_v3/outs/filtered_feature_bc_matrix/barcodes.tsv.gz", col_names = FALSE) %>%
  dplyr::select(1) %>%
  t() %>%
  as.vector() %>%
  gsub(pattern = '-1', replacement = '')
rownames(temp) <- readr::read_tsv("results/pbmc_10k_v3/cell_ranger/pbmc_10k_v3/outs/filtered_feature_bc_matrix/features.tsv.gz", col_names = FALSE) %>%
  dplyr::select(1) %>%
  t() %>%
  as.vector() %>%
  make.unique(sep = "_")

any(duplicated(rownames(temp)))
# FALSE

## remove non-expressed genes
expressed_genes <- Matrix::rowSums(temp)
expressed_genes <- which(expressed_genes > 0)
temp <- temp[expressed_genes,]

feature_matrix$cell_ranger_filtered_barcodes <- temp
STARsolo
All cellular barcodes
temp <- Matrix::readMM("results/pbmc_10k_v3/STAR/STARsolo/Gene/raw/matrix.mtx.gz")
colnames(temp) <- readr::read_tsv("results/pbmc_10k_v3/STAR/STARsolo/Gene/raw/barcodes.tsv.gz", col_names = FALSE) %>%
  dplyr::select(1) %>%
  t() %>%
  as.vector()
rownames(temp) <- readr::read_tsv("results/pbmc_10k_v3/STAR/STARsolo/Gene/raw/features.tsv.gz", col_names = FALSE) %>%
  dplyr::select(1) %>%
  t() %>%
  as.vector()

any(duplicated(rownames(temp)))
# FALSE

## remove non-expressed genes
expressed_genes <- Matrix::rowSums(temp)
expressed_genes <- which(expressed_genes > 0)
temp <- temp[expressed_genes,]

## remove empty cells
empty_cells <- Matrix::colSums(temp)
empty_cells <- which(empty_cells == 0)
temp <- temp[,-empty_cells]

feature_matrix$starsolo_all_barcodes <- temp
Filtered cellular barcodes
temp <- Matrix::readMM("results/pbmc_10k_v3/STAR/STARsolo/Gene/filtered/matrix.mtx.gz")
colnames(temp) <- readr::read_tsv("results/pbmc_10k_v3/STAR/STARsolo/Gene/filtered/barcodes.tsv.gz", col_names = FALSE) %>%
  dplyr::select(1) %>%
  t() %>%
  as.vector()
rownames(temp) <- readr::read_tsv("results/pbmc_10k_v3/STAR/STARsolo/Gene/filtered/features.tsv.gz", col_names = FALSE) %>%
  dplyr::select(1) %>%
  t() %>%
  as.vector()

any(duplicated(rownames(temp)))
# FALSE

## remove non-expressed genes
expressed_genes <- Matrix::rowSums(temp)
expressed_genes <- which(expressed_genes > 0)
temp <- temp[expressed_genes,]

feature_matrix$starsolo_filtered_barcodes <- temp
Cellular barcodes from Cell Ranger
cells <- colnames(feature_matrix$cell_ranger_filtered_barcodes) %>%
  gsub(pattern = '-1', replacement = '')
temp <- feature_matrix$starsolo_all_barcodes[,cells]

any(duplicated(rownames(temp)))
# FALSE

## remove non-expressed genes
expressed_genes <- Matrix::rowSums(temp)
expressed_genes <- which(expressed_genes > 0)
temp <- temp[expressed_genes,]

feature_matrix$starsolo_cell_ranger_whitelist <- temp
Alevin
All cellular barcodes
temp <- Matrix::readMM("results/pbmc_10k_v3/alevin/raw/alevin/quants_mat.mtx.gz") %>%
  Matrix::t()
colnames(temp) <- readr::read_tsv("results/pbmc_10k_v3/alevin/raw/alevin/quants_mat_rows.txt", col_names = FALSE) %>%
  dplyr::select(1) %>%
  t() %>%
  as.vector()
rownames(temp) <- readr::read_tsv("results/pbmc_10k_v3/alevin/raw/alevin/quants_mat_cols.txt", col_names = FALSE) %>%
  dplyr::select(1) %>%
  t() %>%
  as.vector()

any(duplicated(rownames(temp)))
# FALSE

## remove non-expressed genes
expressed_genes <- Matrix::rowSums(temp)
expressed_genes <- which(expressed_genes > 0)
temp <- temp[expressed_genes,]

## remove empty cells
empty_cells <- Matrix::colSums(temp)
empty_cells <- which(empty_cells == 0)
# no empty cells

feature_matrix$alevin_all_barcodes <- temp
Filtered cellular barcodes
temp <- Matrix::readMM("results/pbmc_10k_v3/alevin/filtered/alevin/quants_mat.mtx.gz") %>%
  Matrix::t()
colnames(temp) <- readr::read_tsv("results/pbmc_10k_v3/alevin/filtered/alevin/quants_mat_rows.txt", col_names = FALSE) %>%
  dplyr::select(1) %>%
  t() %>%
  as.vector()
rownames(temp) <- readr::read_tsv("results/pbmc_10k_v3/alevin/filtered/alevin/quants_mat_cols.txt", col_names = FALSE) %>%
  dplyr::select(1) %>%
  t() %>%
  as.vector()

any(duplicated(rownames(temp)))
# FALSE

## remove non-expressed genes
expressed_genes <- Matrix::rowSums(temp)
expressed_genes <- which(expressed_genes > 0)
temp <- temp[expressed_genes,]

feature_matrix$alevin_filtered_barcodes <- temp
Cellular barcodes from Cell Ranger
cells <- colnames(feature_matrix$cell_ranger_filtered_barcodes) %>%
  gsub(pattern = '-1', replacement = '')
temp <- feature_matrix$alevin_all_barcodes[,cells]

any(duplicated(rownames(temp)))
# FALSE

## remove non-expressed genes
expressed_genes <- Matrix::rowSums(temp)
expressed_genes <- which(expressed_genes > 0)
temp <- temp[expressed_genes,]

feature_matrix$alevin_cell_ranger_whitelist <- temp
kallisto
All cellular barcodes
temp <- Matrix::readMM("results/pbmc_10k_v3/kallisto/genecount/genes.mtx") %>% Matrix::t()
colnames(temp) <- readr::read_tsv("results/pbmc_10k_v3/kallisto/genecount/genes.barcodes.txt", col_names = FALSE) %>%
  dplyr::select(1) %>%
  t() %>%
  as.vector()
rownames(temp) <- readr::read_tsv("results/pbmc_10k_v3/kallisto/genecount/genes.genes.txt", col_names = FALSE) %>%
  dplyr::select(1) %>%
  t() %>%
  as.vector()

any(duplicated(rownames(temp)))
# FALSE

# remove non-expressed genes
expressed_genes <- Matrix::rowSums(temp)
expressed_genes <- which(expressed_genes > 0)
temp <- temp[expressed_genes,]

# remove empty cells
empty_cells <- Matrix::colSums(temp)
empty_cells <- which(empty_cells == 0)
temp <- temp[,-empty_cells]

feature_matrix$kallisto_all_barcodes <- temp
Cellular barcodes from Cell Ranger
cells <- colnames(feature_matrix$cell_ranger_filtered) %>%
  gsub(pattern = '-1', replacement = '')
temp <- feature_matrix$kallisto_all_barcodes[,cells]

any(duplicated(rownames(temp)))
# FALSE

## remove non-expressed genes
expressed_genes <- Matrix::rowSums(temp)
expressed_genes <- which(expressed_genes > 0)
temp <- temp[expressed_genes,]

feature_matrix$kallisto_cell_ranger_whitelist <- temp
Save data
Finally, we save the object that contains all the transcript count matrices.
saveRDS(feature_matrix, 'results/pbmc_10k_v3/merged_data/feature_matrix.rds')
Color code
A coherent color code helps to quickly read the data.
color_assignments <- c(
  'Cell Ranger'                = '#c0392b',
  'STARsolo'                   = '#2980b9',
  'Alevin (all barcodes)'      = '#f39c12',
  'Alevin (filtered barcodes)' = '#f39c12',
  'kallisto'                   = '#20bf6b',
  'Cell Ranger (all barcodes)'       = '#c0392b',
  'Cell Ranger (filtered barcodes)'  = '#c0392b',
  'STARsolo (all barcodes)'          = '#2980b9',
  'STARsolo (filtered barcodes)'     = '#2980b9',
  'STARsolo (Cell Ranger whitelist)' = '#2980b9',
  'Alevin (all barcodes)'            = '#f39c12',
  'Alevin (filtered barcodes)'       = '#f39c12',
  'Alevin (Cell Ranger whitelist)'   = '#f39c12',
  'kallisto (all barcodes)'          = '#20bf6b',
  'kallisto (Cell Ranger whitelist)' = '#20bf6b'
)
Collect meta data
Now, we collect some meta data.
Runs
Here, we put together the run statistics, including the run time, peak memory usage, etc.
library(lubridate)

meta_data_runs <- tribble(
                            ~run,  ~run_time,  ~CPU_hours,   ~mem_KB,  ~vmem_KB,
    'Cell Ranger'               , '20:39:07', '222:30:36', 125829116, 125829120,
    'STARsolo'                  , '00:34:45',  '09:10:46',  45942620,  46475712,
    'Alevin (all barcodes)'     , '03:09:25',  '53:05:08',  21223076,  34565292,
    'Alevin (filtered barcodes)', '00:59:45',  '13:06:48',  18361588,  33971372,
    'kallisto'                  , '00:35:09',  '01:54:21',  13737072,  14877188
  ) %>%
  mutate(
    run = factor(run, levels = run),
    run_time = hms(run_time),
    run_time = hour(run_time)*60 + minute(run_time) + second(run_time)/60,
    CPU_hours = hms(CPU_hours),
    CPU_hours = hour(CPU_hours) + minute(CPU_hours)/60,
    mem_GB = mem_KB/1E6,
    vmem_GB = vmem_KB/1E6
  )

saveRDS(meta_data_runs, 'results/pbmc_10k_v3/merged_data/meta_data_runs.rds')

knitr::kable(meta_data_runs)
| Run time [min] | CPU time [h] | mem [GB] | vmem [GB] | |
|---|---|---|---|---|
| Cell Ranger | 1239.1 | 222.5 | 125.8 | 125.8 |
| STARsolo | 34.8 | 9.2 | 45.9 | 46.5 |
| Alevin (all barcodes) | 189.4 | 53.1 | 21.2 | 34.6 |
| Alevin (filtered barcodes) | 59.8 | 13.1 | 18.4 | 34.0 |
| kallisto | 35.2 | 1.9 | 13.7 | 14.9 |
Cells
Let’s define the group levels.
group_levels <- c(
  'Cell Ranger (all barcodes)',
  'Cell Ranger (filtered barcodes)',
  'STARsolo (all barcodes)',
  'STARsolo (filtered barcodes)',
  'STARsolo (Cell Ranger whitelist)',
  'Alevin (all barcodes)',
  'Alevin (filtered barcodes)',
  'Alevin (Cell Ranger whitelist)',
  'kallisto (all barcodes)',
  'kallisto (Cell Ranger whitelist)'
)
Here, for every transcript count matrix we got, we count the number of transcripts and number of expressed genes per cell and rank them by the number of transcripts (we will need that later).
temp_cell_ranger_all_barcodes <- tibble(
    group = 'Cell Ranger (all barcodes)',
    cell = feature_matrix$cell_ranger_all_barcodes %>% colnames(),
    nUMI = feature_matrix$cell_ranger_all_barcodes %>% Matrix::colSums(),
    nGene = Matrix::colSums(feature_matrix$cell_ranger_all_barcodes != 0)
  ) %>%
  dplyr::arrange(-nUMI) %>%
  dplyr::mutate(rank = seq(1:nrow(.)))

temp_cell_ranger_filtered_barcodes <- tibble(
    group = 'Cell Ranger (filtered barcodes)',
    cell = feature_matrix$cell_ranger_filtered_barcodes %>% colnames(),
    nUMI = feature_matrix$cell_ranger_filtered_barcodes %>% Matrix::colSums(),
    nGene = Matrix::colSums(feature_matrix$cell_ranger_filtered_barcodes != 0)
  ) %>%
  dplyr::arrange(-nUMI) %>%
  dplyr::mutate(rank = seq(1:nrow(.)))

temp_starsolo_all_barcodes <- tibble(
    group = 'STARsolo (all barcodes)',
    cell = feature_matrix$starsolo_all_barcodes %>% colnames(),
    nUMI = feature_matrix$starsolo_all_barcodes %>% Matrix::colSums(),
    nGene = Matrix::colSums(feature_matrix$starsolo_all_barcodes != 0)
  ) %>%
  dplyr::arrange(-nUMI) %>%
  dplyr::mutate(rank = seq(1:nrow(.)))

temp_starsolo_filtered_barcodes <- tibble(
    group = 'STARsolo (filtered barcodes)',
    cell = feature_matrix$starsolo_filtered_barcodes %>% colnames(),
    nUMI = feature_matrix$starsolo_filtered_barcodes %>% Matrix::colSums(),
    nGene = Matrix::colSums(feature_matrix$starsolo_filtered_barcodes != 0)
  ) %>%
  dplyr::arrange(-nUMI) %>%
  dplyr::mutate(rank = seq(1:nrow(.)))

temp_starsolo_cell_ranger_whitelist <- tibble(
    group = 'STARsolo (Cell Ranger whitelist)',
    cell = feature_matrix$starsolo_cell_ranger_whitelist %>% colnames(),
    nUMI = feature_matrix$starsolo_cell_ranger_whitelist %>% Matrix::colSums(),
    nGene = Matrix::colSums(feature_matrix$starsolo_cell_ranger_whitelist != 0)
  ) %>%
  dplyr::arrange(-nUMI) %>%
  dplyr::mutate(rank = seq(1:nrow(.)))

temp_alevin_all_barcodes <- tibble(
    group = 'Alevin (all barcodes)',
    cell = feature_matrix$alevin_all_barcodes %>% colnames(),
    nUMI = feature_matrix$alevin_all_barcodes %>% Matrix::colSums(),
    nGene = Matrix::colSums(feature_matrix$alevin_all_barcodes != 0)
  ) %>%
  dplyr::arrange(-nUMI) %>%
  dplyr::mutate(rank = seq(1:nrow(.)))

temp_alevin_filtered_barcodes <- tibble(
    group = 'Alevin (filtered barcodes)',
    cell = feature_matrix$alevin_filtered_barcodes %>% colnames(),
    nUMI = feature_matrix$alevin_filtered_barcodes %>% Matrix::colSums(),
    nGene = Matrix::colSums(feature_matrix$alevin_filtered_barcodes != 0)
  ) %>%
  dplyr::arrange(-nUMI) %>%
  dplyr::mutate(rank = seq(1:nrow(.)))

temp_alevin_cell_ranger_whitelist <- tibble(
    group = 'Alevin (Cell Ranger whitelist)',
    cell = feature_matrix$alevin_cell_ranger_whitelist %>% colnames(),
    nUMI = feature_matrix$alevin_cell_ranger_whitelist %>% Matrix::colSums(),
    nGene = Matrix::colSums(feature_matrix$alevin_cell_ranger_whitelist != 0)
  ) %>%
  dplyr::arrange(-nUMI) %>%
  dplyr::mutate(rank = seq(1:nrow(.)))

temp_kallisto_all_barcodes <- tibble(
    group = 'kallisto (all barcodes)',
    cell = feature_matrix$kallisto_all_barcodes %>% colnames(),
    nUMI = feature_matrix$kallisto_all_barcodes %>% Matrix::colSums(),
    nGene = Matrix::colSums(feature_matrix$kallisto_all_barcodes != 0)
  ) %>%
  dplyr::arrange(-nUMI) %>%
  dplyr::mutate(rank = seq(1:nrow(.)))

temp_kallisto_cell_ranger_whitelist <- tibble(
    group = 'kallisto (Cell Ranger whitelist)',
    cell = feature_matrix$kallisto_cell_ranger_whitelist %>% colnames(),
    nUMI = feature_matrix$kallisto_cell_ranger_whitelist %>% Matrix::colSums(),
    nGene = Matrix::colSums(feature_matrix$kallisto_cell_ranger_whitelist != 0)
  ) %>%
  dplyr::arrange(-nUMI) %>%
  dplyr::mutate(rank = seq(1:nrow(.)))

meta_data_cells <- bind_rows(
    temp_cell_ranger_all_barcodes,
    temp_cell_ranger_filtered_barcodes,
    temp_starsolo_all_barcodes,
    temp_starsolo_filtered_barcodes,
    temp_starsolo_cell_ranger_whitelist,
    temp_alevin_all_barcodes,
    temp_alevin_filtered_barcodes,
    temp_alevin_cell_ranger_whitelist,
    temp_kallisto_all_barcodes,
    temp_kallisto_cell_ranger_whitelist
  ) %>%
  dplyr::mutate(group = factor(group, levels = group_levels))

saveRDS(meta_data_cells, 'results/pbmc_10k_v3/merged_data/meta_data_cells.rds')
Run time
The run time is defined as the time it took a job to finish after it was started.
p <- meta_data_runs %>%
  mutate(run = fct_rev(run)) %>%
  ggplot(aes(run_time, run, fill = run)) +
  geom_bar(stat = 'identity', position = 'dodge', color = 'black') +
  geom_label(
    aes(
      hjust = ifelse(run == 'Cell Ranger', 1.2, -0.2),
      label = scales::comma(round(run_time, digits = 1))
    ),
    fill = 'white', alpha = 0.75
  ) +
  scale_x_continuous(
    name = 'Run time [minutes]', labels = scales::comma, expand = c(0.01, 0),
    breaks = seq(0, 1500, by = 200)
  ) +
  scale_y_discrete(name = '') +
  scale_fill_manual(values = color_assignments) +
  theme_bw() +
  theme(
    legend.position = 'none',
    panel.grid.major.y = element_blank()
  )
ggsave('results/pbmc_10k_v3/plots/run_time.png', p, height = 2.5, width = 8)
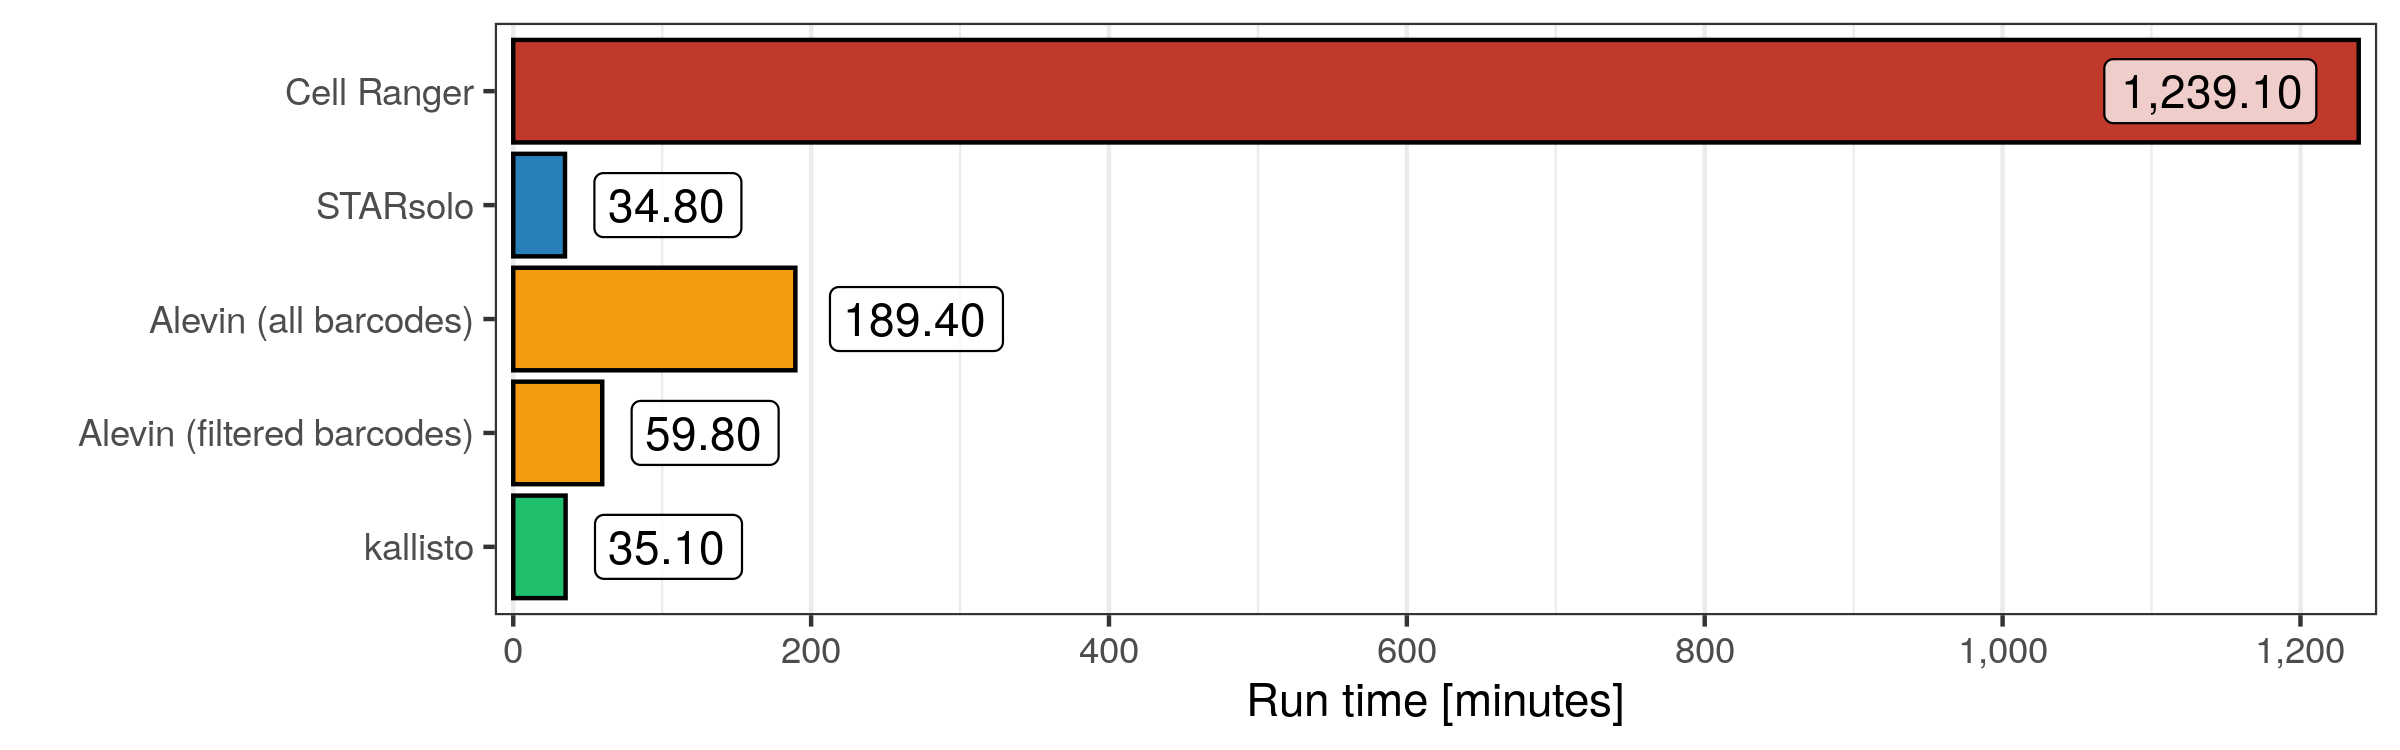
STARsolo and kallisto both finished in just 35 minutes, while Alevin needed either about 60 minutes with a filtered whitelist or almost 200 minutes when quantifying the transcript counts for all valid cellular barcodes. Cell Ranger, which internally uses STAR but not the STARsolo mode, needed more than 20 hours.
CPU hours
The measure “CPU hours” reflects exactly what it says: the cumulative hours used across all the cores that were engaged in the job. For example, a 30 minute long job using 10 cores would have the same CPU hours as a 1 hour long job using 5 cores (assuming that all cores were engaged the entire time): 5 CPU hours. This measure is taken from the run summary of the PBE scheduler and I cannot comment on how reliable it is.
p <- meta_data_runs %>%
  mutate(run = fct_rev(run)) %>%
  ggplot(aes(CPU_hours, run, fill = run)) +
  geom_bar(stat = 'identity', position = 'dodge', color = 'black', show.legend = FALSE) +
  geom_label(
    aes(
      hjust = ifelse(run == 'Cell Ranger', 1.2, -0.2),
      label = scales::comma(round(CPU_hours, digits = 1))
    ),
    fill = 'white', alpha = 0.75
  ) +
  scale_x_continuous(
    name = 'CPU time [hours]', labels = scales::comma, expand = c(0.01, 0),
    breaks = seq(0, 300, by = 50)
  ) +
  scale_y_discrete(name = '') +
  scale_fill_manual(values = color_assignments) +
  theme_bw() +
  theme(
    legend.position = 'none',
    panel.grid.major.y = element_blank()
  )
ggsave('results/pbmc_10k_v3/plots/cpu_hours.png', p, height = 2.5, width = 8)
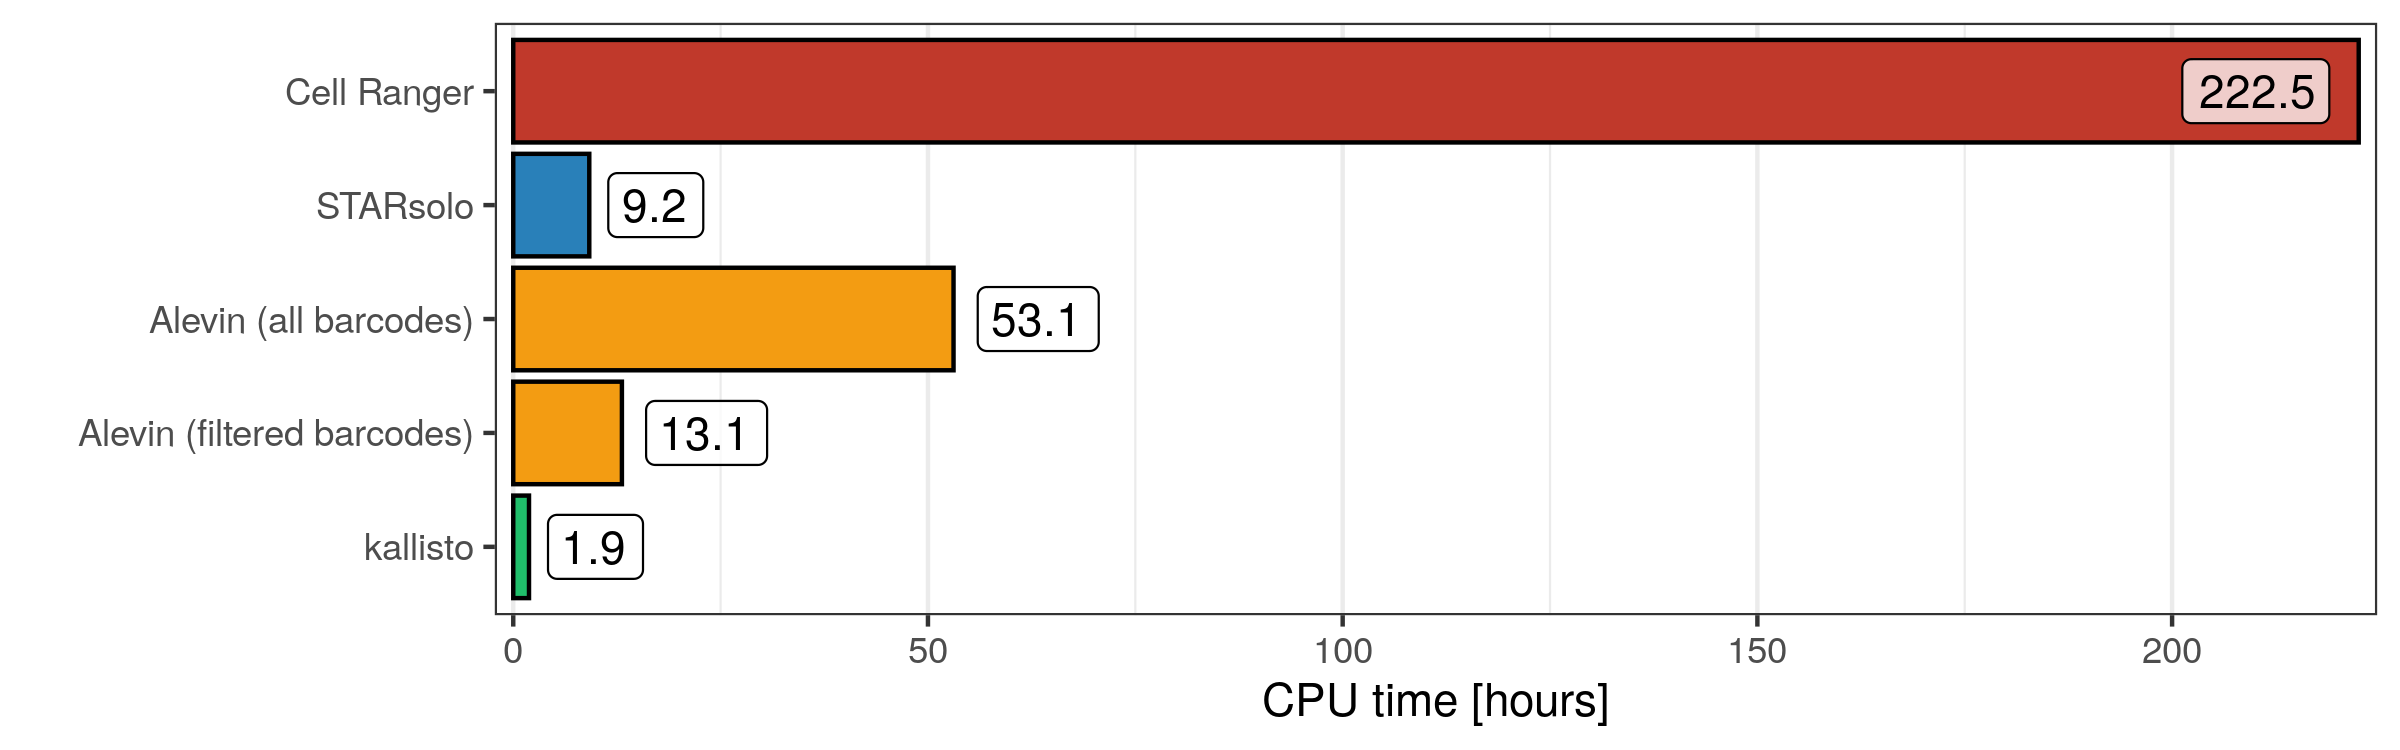
As expected, since in principle every job had the same number of cores available (20), Cell Ranger accumulated the most CPU hours, with Alevin (all barcodes) trailing behind. Interestingly, STARsolo used more CPU hours than kallisto, even though they had the same run time. While this is impressive, it is also important to keep in mind that STAR aligns the reads to the genome, while kallisto (only) analyses the transcriptome, which of course is much smaller.
Peak memory usage
It would be great to have a temporal profile of memory occupancy during the job, but unfortunately that appears to be quite complicated to record. Instead, here we see the memory usage as reported by the PBE job scheduler. As far as I know, this number corresponds to the highest (peak) usage throughout the entire job, meaning that we don’t know anything about how this value potentially fluctuates.
p <- meta_data_runs %>%
  mutate(run = fct_rev(run)) %>%
  dplyr::rename(mem = mem_GB, vmem = vmem_GB) %>%
  pivot_longer(
   cols = c('mem','vmem'),
   names_to = 'category',
   values_to = 'memory'
  ) %>%
  dplyr::mutate(category = factor(category, levels = c('vmem','mem'))) %>%
  ggplot(aes(memory, run, fill = category)) +
  geom_col(position = position_dodge(width = 1), color = 'black') +
  geom_label(
    aes(
      group = category, label = format(round(memory, digits = 1), trim = TRUE),
      hjust = ifelse(run == 'Cell Ranger', 1.2, -0.2)
    ),
    position = position_dodge(width = 1), fill = 'white', alpha = 0.75,
    size = 3, label.padding = unit(0.1, 'lines')
  ) +
  scale_x_continuous(name = 'Memory [GB]', labels = scales::comma, expand = c(0.01, 0)) +
  scale_y_discrete(name = '') +
  scale_fill_brewer(
    name = '', palette = 'Set1', direction = -1,
    guide = guide_legend(reverse = TRUE)
  ) +
  theme_bw() +
  theme(
    legend.position = 'right',
    panel.grid.major.y = element_blank()
  )
ggsave('results/pbmc_10k_v3/plots/memory_footprint.png', p, height = 2.5, width = 8)
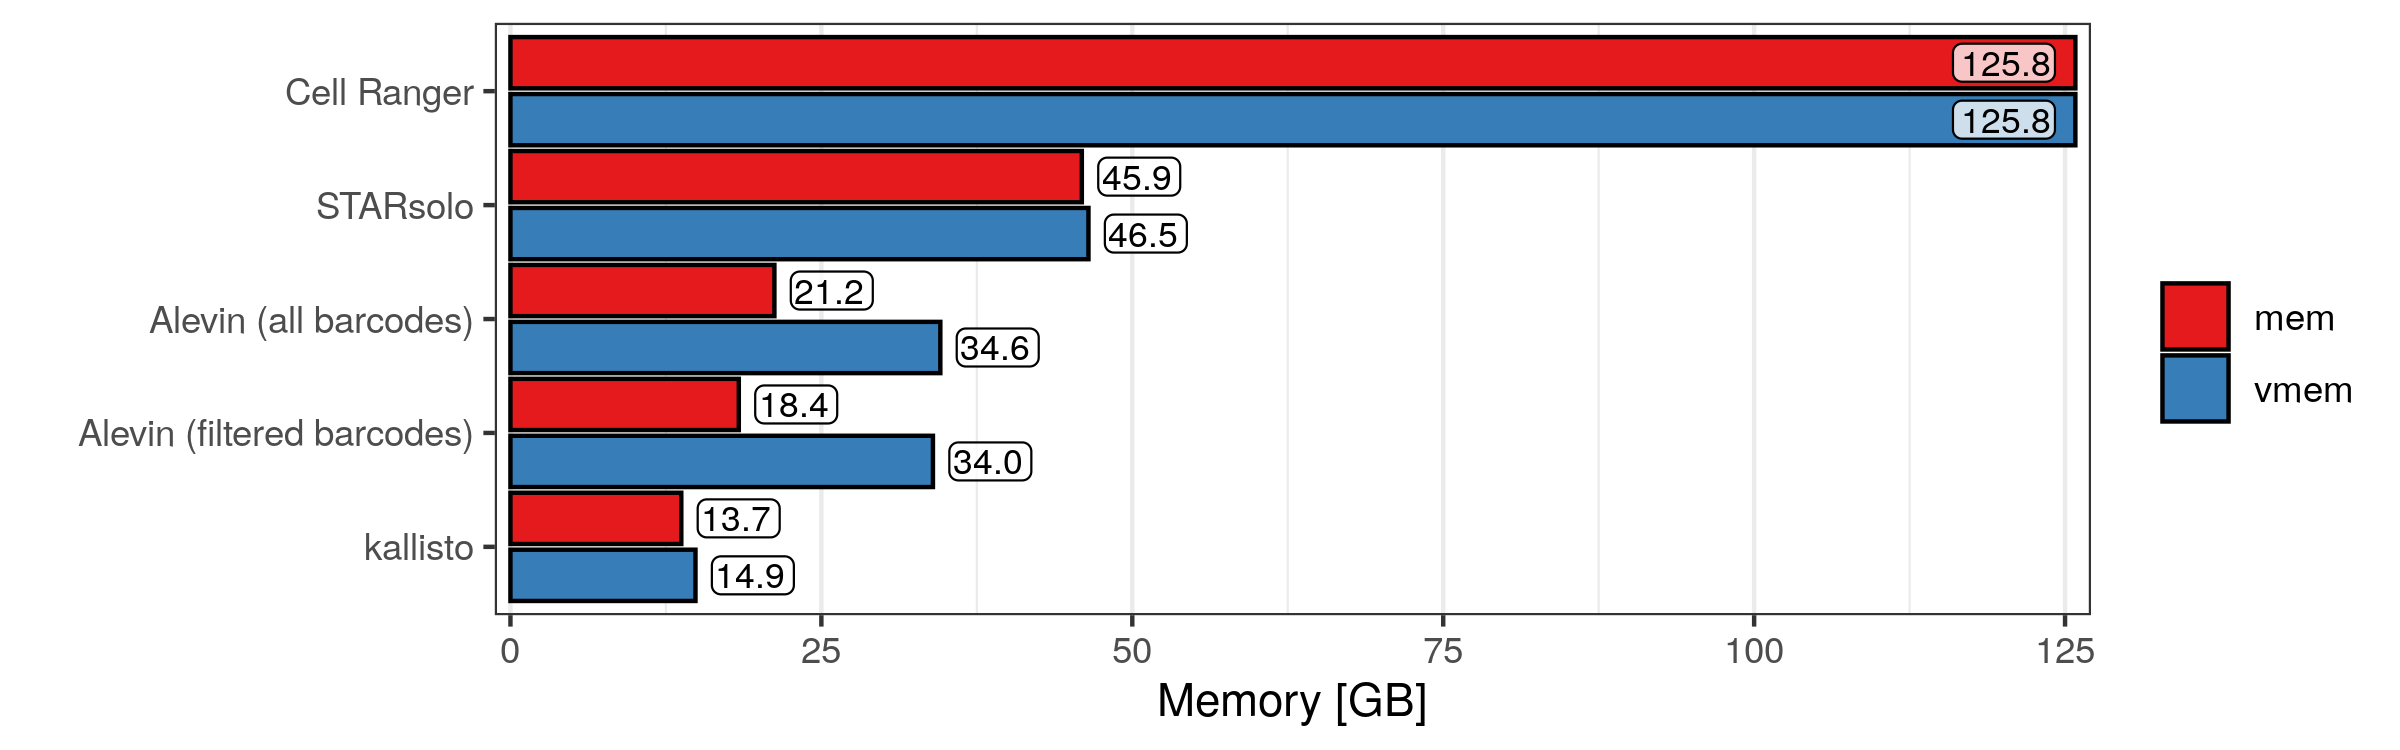
Here we have some surprising results, or at least I think so. I’m not too familiar with the distinction between physical and virtual memory, but I don’t know if it makes sense that they have almost identical values in every run. Then, perhaps one would assume that, since Cell Ranger takes so long and it uses so many CPU hours, at least it doesn’t need a lot of memory. But apparently that is not the case, as Cell Ranger uses all of the memory it was given (at least momentarily, possibly the whole time). Also, when analysing all valid cellular barcodes, Alevin scores the lowest memory usage, despite the high CPU hours it needed. Again, kallisto performs well with a memory usage of less than 40 GB.
Number of cells
Next, I looked at the number of cells that were identified in each run.
p <- meta_data_cells %>%
  group_by(group) %>%
  summarise(cell_count = n()) %>%
  mutate(group = fct_rev(group)) %>%
  ggplot(aes(cell_count, group, fill = group)) +
  geom_col(position = 'dodge', color = 'black') +
  geom_label(
    aes(label = format(round(cell_count, digits = 1), big.mark = ',', trim = TRUE)),
    hjust = 1.1, position = position_dodge(width = 1), fill = 'white', alpha = 0.75,
    size = 4
  ) +
  scale_x_log10(
    name = 'Number of cells', expand = c(0.01, 0),
    breaks = c(1E0, 1E1,1E2,1E3,1E4,1E5,1E6),
    labels = scales::trans_format('log10', scales::math_format(10^.x))
  ) +
  scale_y_discrete(name = '', expand = c(0.1, 0)) +
  scale_fill_manual(values = color_assignments) +
  annotation_logticks(
    side = 'b', short = unit(0.15, 'cm'), mid = unit(0.15, 'cm'),
    long = unit(0.2, 'cm')
  ) +
  theme_bw() +
  theme(
    legend.position = 'none',
    panel.grid.minor.x = element_blank(),
    panel.grid.major.y = element_blank()
  )
ggsave('results/pbmc_10k_v3/plots/number_of_cells.png', p, height = 4, width = 8)
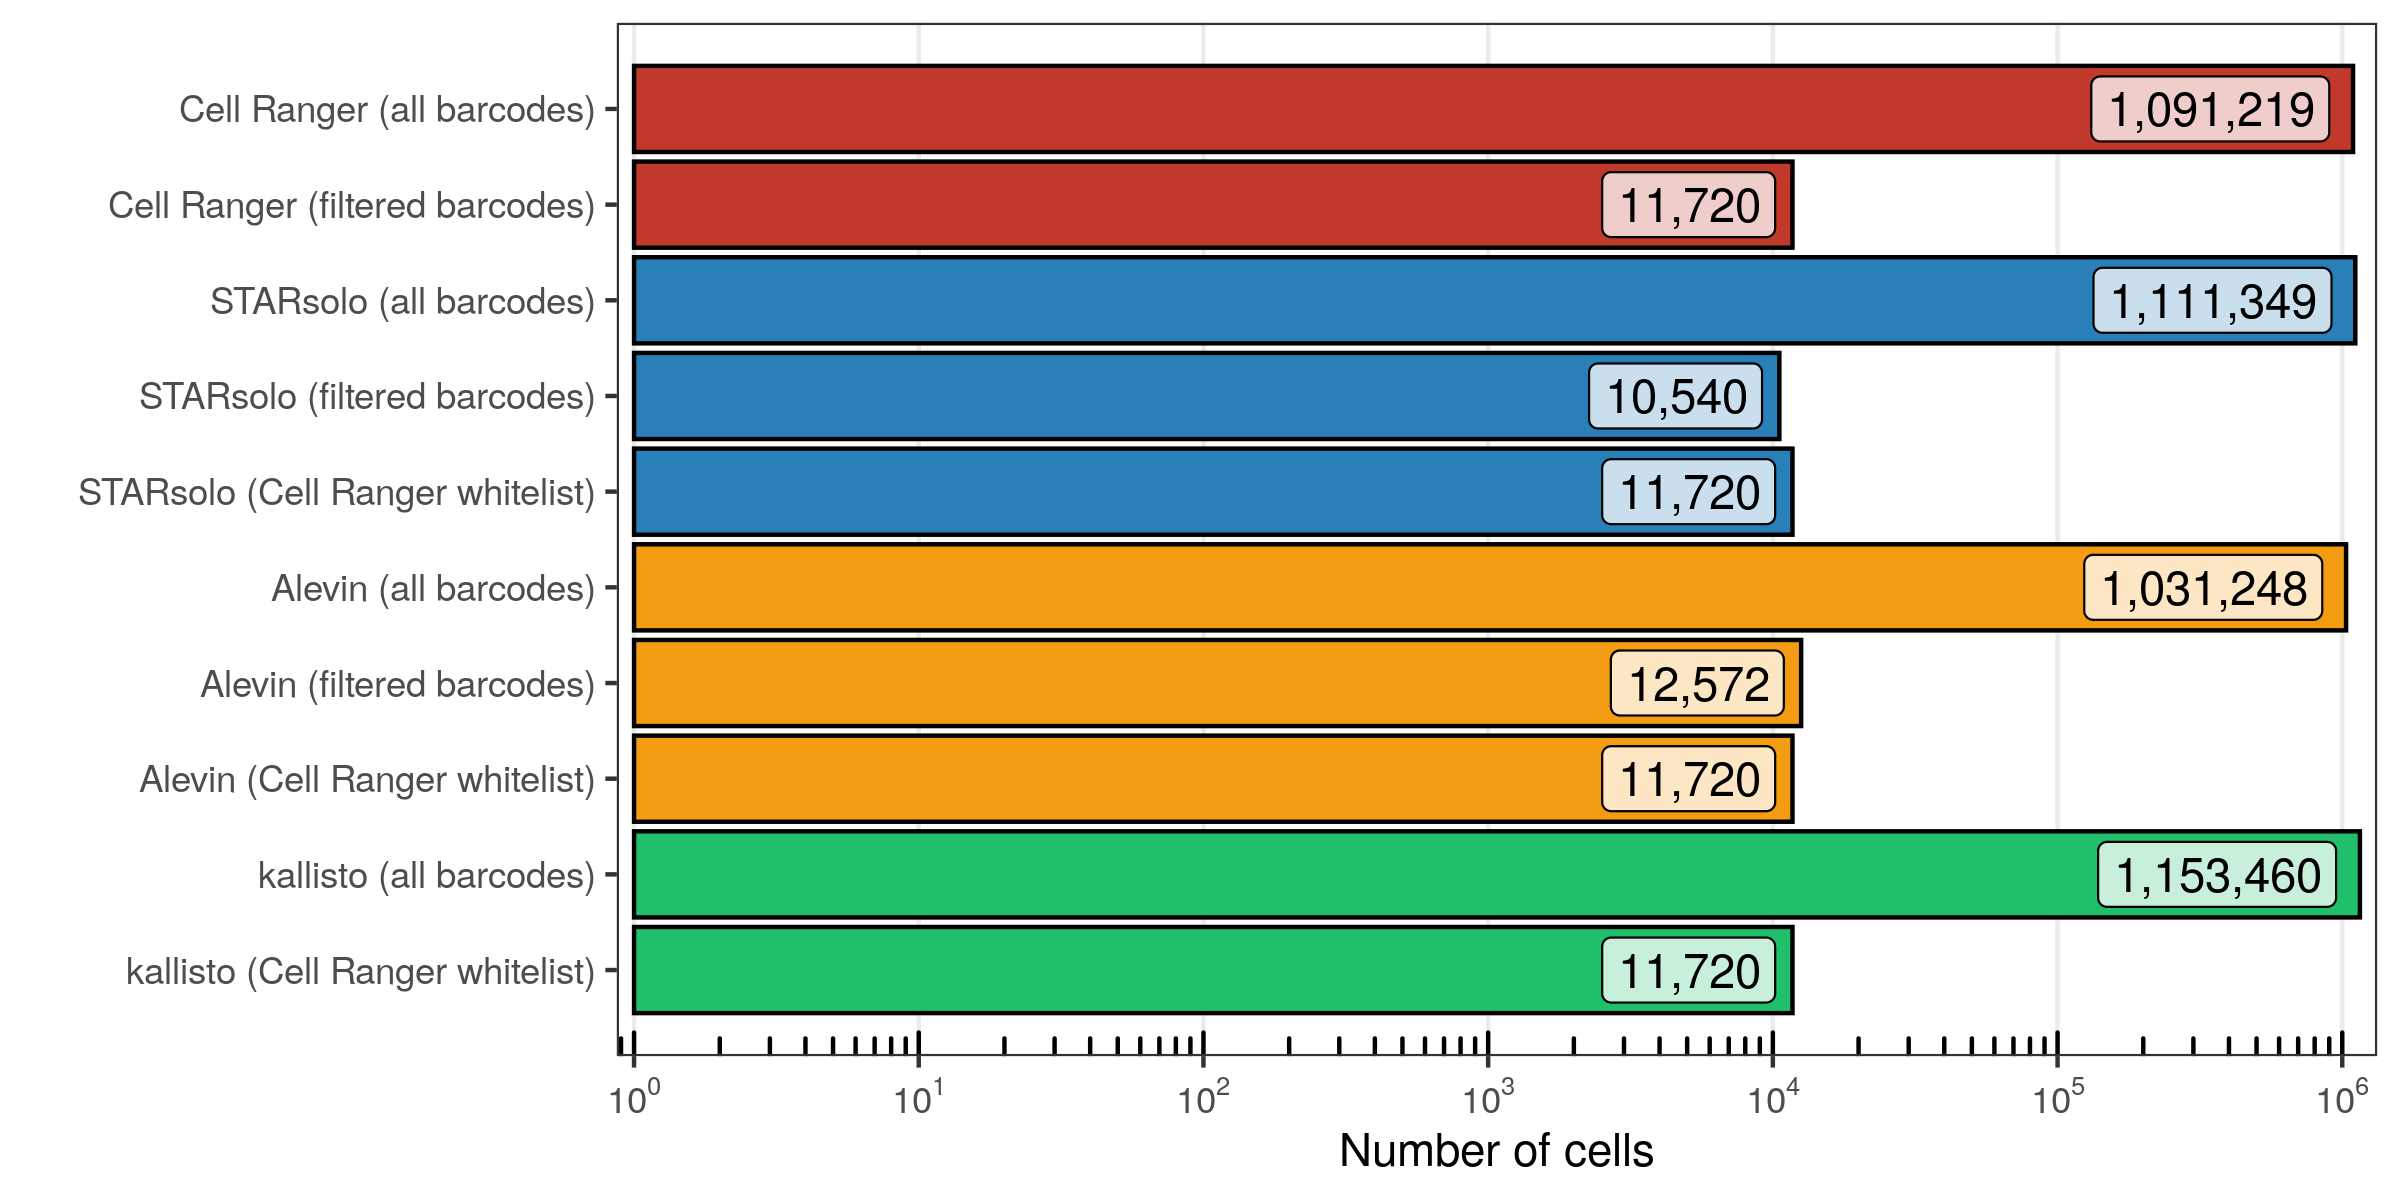
To no suprise, when providing the whitelist generated by Cell Ranger, Alevin extracted the same cellular barcodes. Conveniently, both STARsolo and kallisto only needed to be run once and provide us with the transcript counts for all cellular barcodes, meaning that we can simply extract the cells identified by Cell Ranger. STARsolo and Alevin, using their own filtering algorithms, retrieved similar cell counts as Cell Ranger. No drastic differences are seen in the total barcode counts, which are about 1.1 million (Alevin is slightly below the other three).
Total number of transcripts/molecules
Next, I looked at the number of transcripts that were counted across all cells and genes.
p <- meta_data_cells %>%
  group_by(group) %>%
  summarise(nUMI = sum(nUMI)) %>%
  mutate(group = fct_rev(group)) %>%
  ggplot(aes(nUMI, group, fill = group)) +
  geom_col(color = 'black') +
  geom_label(
    aes(label = scales::comma(nUMI)), hjust = 1.1, fill = 'white',
    alpha = 0.75
  ) +
  scale_x_continuous(
    name = 'Total number of transcripts', labels = scales::comma,
    expand = c(0.01, 0)
  ) +
  scale_y_discrete(name = '') +
  scale_fill_manual(values = color_assignments) +
  theme_bw() +
  theme(
    legend.position = 'none',
    panel.grid.minor.x = element_blank(),
    panel.grid.major.y = element_blank()
  )
ggsave('results/pbmc_10k_v3/plots/number_of_transcripts.png', p, height = 4, width = 8)
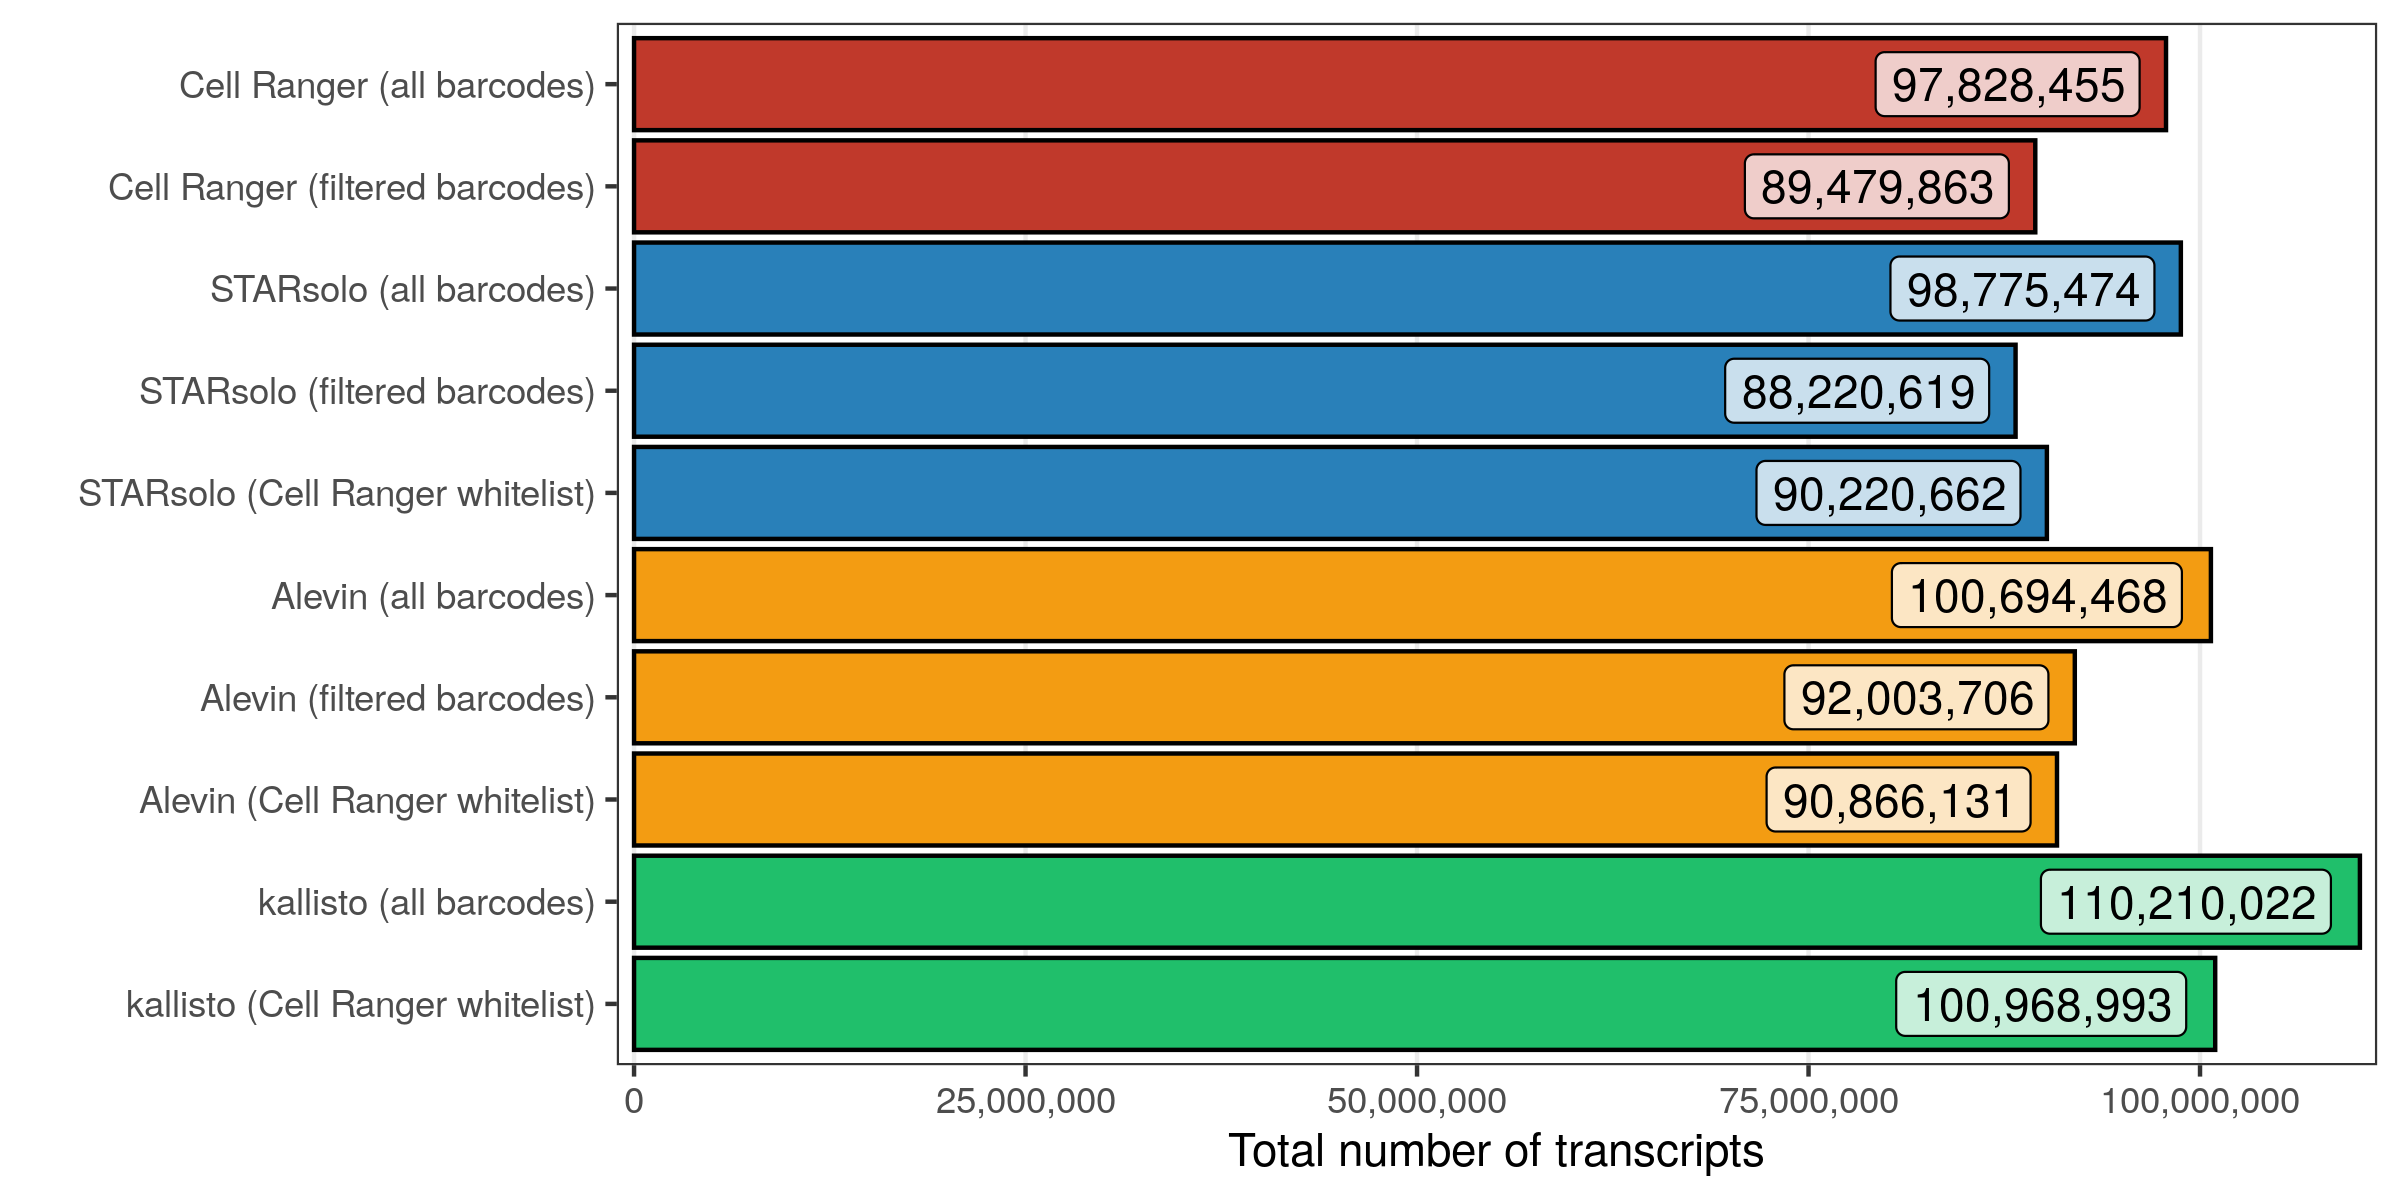
In all cases, roughly 10% of all transcripts (across all cellular barcodes) belong to barcodes that are later filtered out. When using the Cell Ranger whitelist, very similar counts are seen for Cell Ranger, STARsolo, and Alevin. kallisto counted considerably (10%) more transcripts, both for all and filtered barcodes.
Number of expressed genes
Similar to the previous analysis, I also checked how many genes are expressed in at least 1 cell with at least 1 transcript.
p <-
  tibble(
    group = group_levels,
    nGene = c(
      feature_matrix$cell_ranger_all_barcodes %>% nrow(),
      feature_matrix$cell_ranger_filtered_barcodes %>% nrow(),
      feature_matrix$starsolo_all_barcodes %>% nrow(),
      feature_matrix$starsolo_filtered_barcodes %>% nrow(),
      feature_matrix$starsolo_cell_ranger_whitelist %>% nrow(),
      feature_matrix$alevin_all_barcodes %>% nrow(),
      feature_matrix$alevin_filtered_barcodes %>% nrow(),
      feature_matrix$alevin_cell_ranger_whitelist %>% nrow(),
      feature_matrix$kallisto_all_barcodes %>% nrow(),
      feature_matrix$kallisto_cell_ranger_whitelist %>% nrow()
    )
  ) %>%
  dplyr::mutate(group = factor(group, levels = rev(group_levels))) %>%
  ggplot(aes(nGene, group, fill = group)) +
  geom_col(color = 'black') +
  geom_label(
    aes(label = scales::comma(nGene)), hjust = 1.1, fill = 'white',
    alpha = 0.75
  ) +
  scale_x_continuous(
    name = 'Number of expressed genes', labels = scales::comma,
    , expand = c(0.01, 0)
  ) +
  scale_y_discrete(name = '') +
  scale_fill_manual(values = color_assignments) +
  theme_bw() +
  theme(
    legend.position = 'none',
    panel.grid.minor.x = element_blank(),
    panel.grid.major.y = element_blank()
  )
ggsave('results/pbmc_10k_v3/plots/number_of_expressed_genes.png', p, height = 4, width = 8)
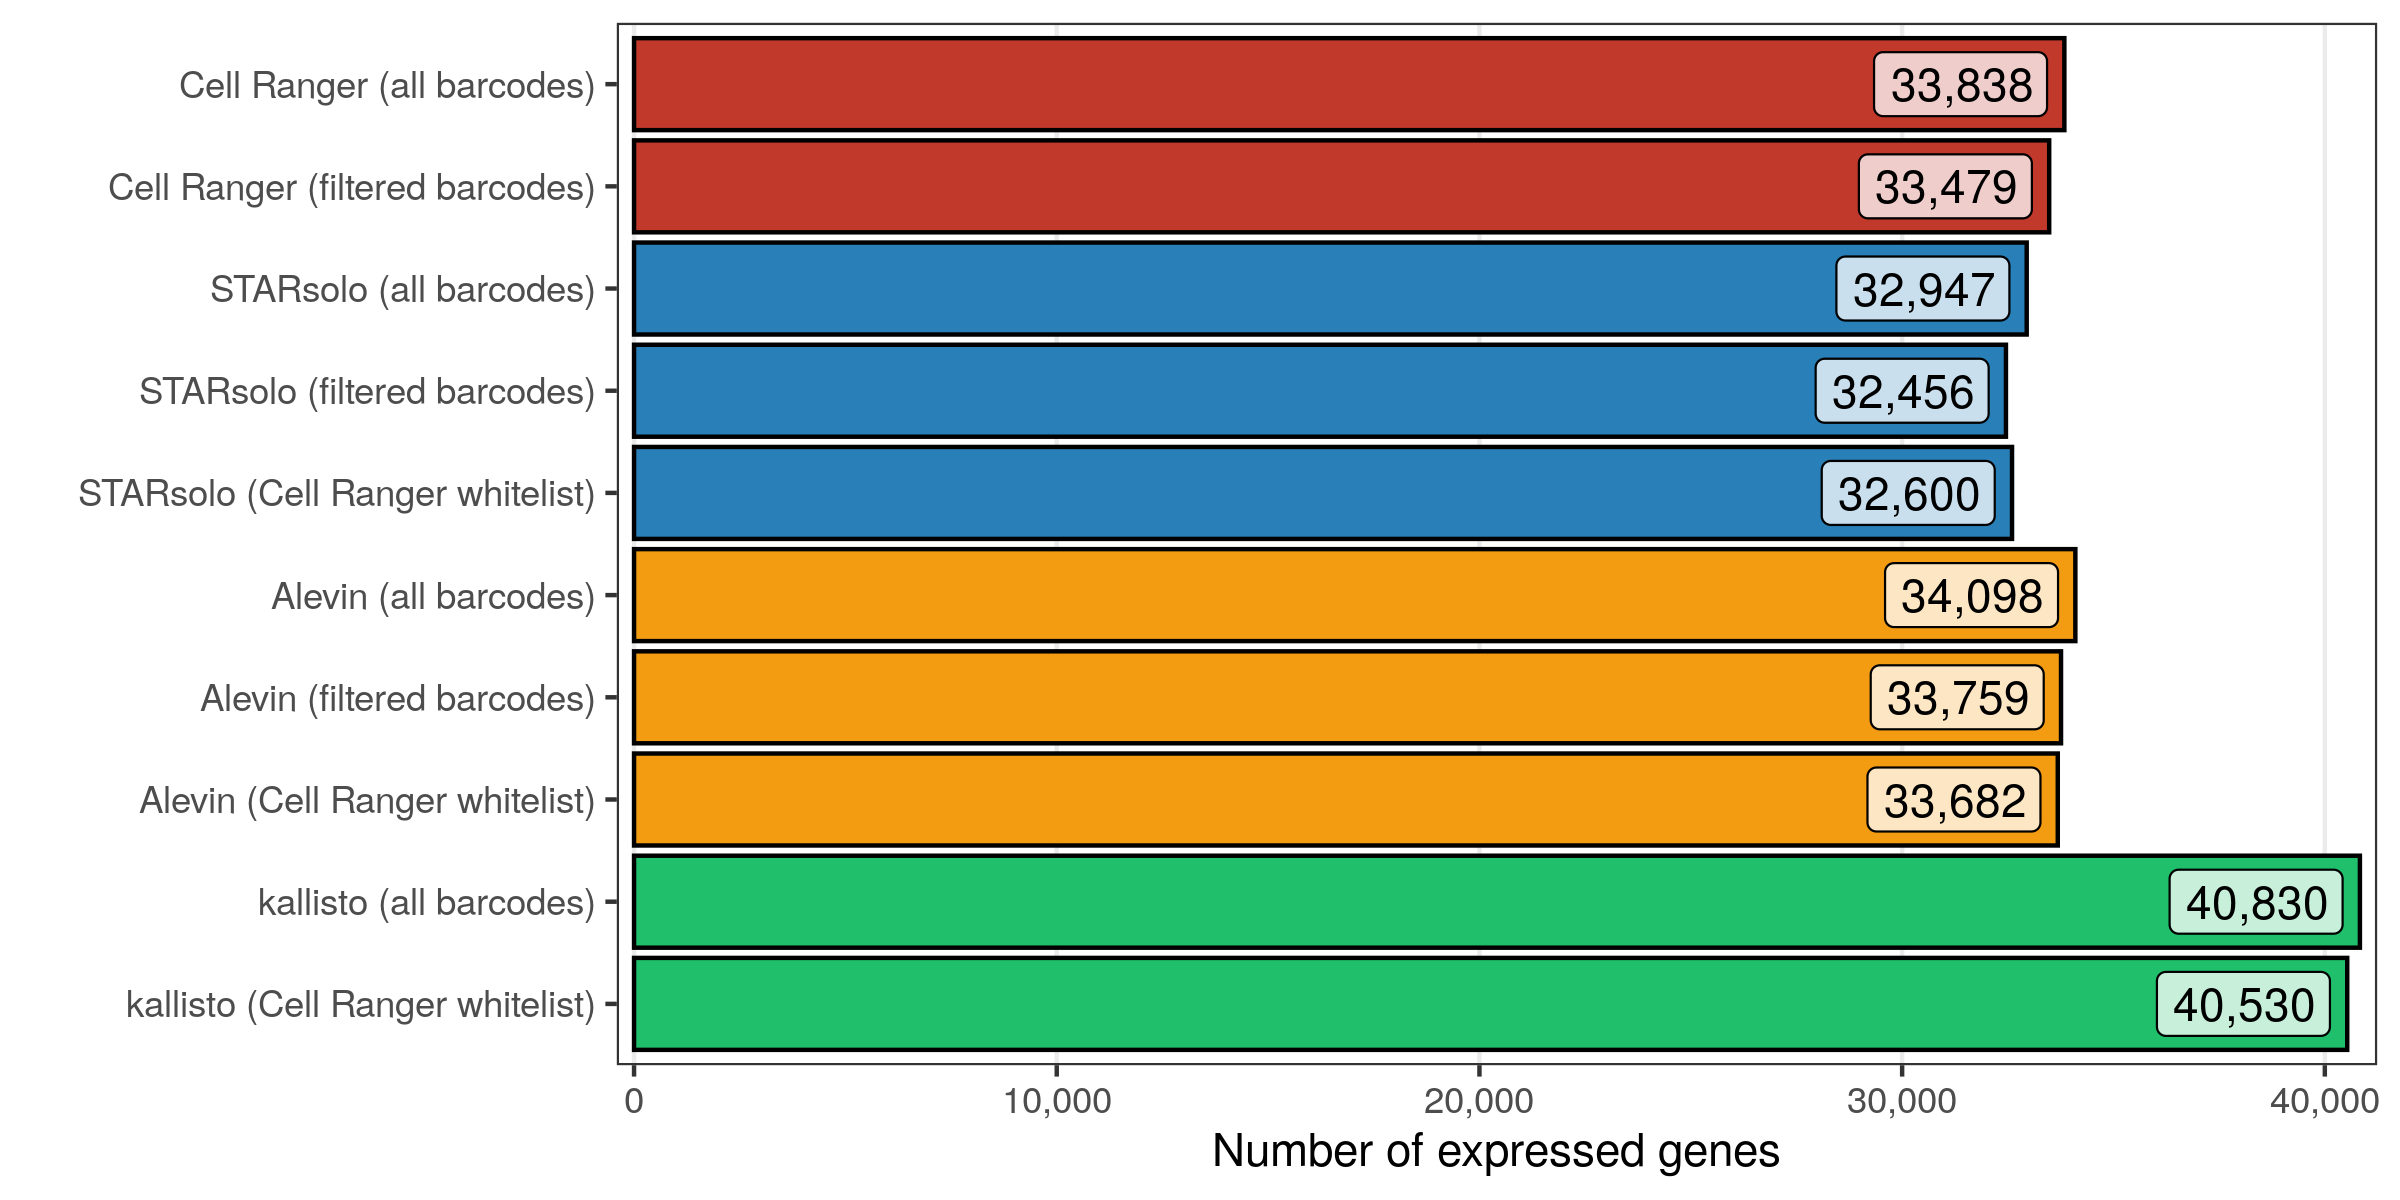
As expected, slightly more genes are expressed in the matrices containing all cellular barcodes, compared to those containing only the filtered cells. While Cell Ranger, STARsolo, and Alevin again provide similar numbers, kallisto found about 20% more genes to be expressed.
Correlation of cells
Here, we focus on those cells whose expression profiles were quantified with all tools, namely those in the Cell Ranger whitelist.
Number of transcripts
First, I compared the number of transcripts that were identified in each cell for every comparison of tools.
library(patchwork)
library(viridis)

temp_groups <- c('Cell Ranger', 'STARsolo', 'Alevin', 'kallisto')

temp <- tibble(
  group.x = character(),
  group.y = character(),
  nUMI.x = numeric(),
  nUMI.y = numeric()
)

for ( i in temp_groups ) {
  for ( j in temp_groups ) {
    ## assign correct name to group 1
    if ( i == 'Cell Ranger' ) {
      temp_group_1 <- 'Cell Ranger (filtered barcodes)'
    } else if ( i == 'STARsolo' ) {
      temp_group_1 <- 'STARsolo (Cell Ranger whitelist)'
    } else if ( i == 'Alevin' ) {
      temp_group_1 <- 'Alevin (Cell Ranger whitelist)'
    } else if ( i == 'kallisto' ) {
      temp_group_1 <- 'kallisto (Cell Ranger whitelist)'
    }
    ## assign correct name to group 2
    if ( j == 'Cell Ranger' ) {
      temp_group_2 <- 'Cell Ranger (filtered barcodes)'
    } else if ( j == 'STARsolo' ) {
      temp_group_2 <- 'STARsolo (Cell Ranger whitelist)'
    } else if ( j == 'Alevin' ) {
      temp_group_2 <- 'Alevin (Cell Ranger whitelist)'
    } else if ( j == 'kallisto' ) {
      temp_group_2 <- 'kallisto (Cell Ranger whitelist)'
    }
    ##
    temp <- bind_rows(
      temp,
      full_join(
        meta_data_cells %>% filter(group == temp_group_1) %>% select(cell, nUMI),
        meta_data_cells %>% filter(group == temp_group_2) %>% select(cell, nUMI),
        by = 'cell'
      ) %>%
      mutate(group.x = i, group.y = j)
    )
  }
}

temp <- temp %>%
  mutate(
    group.x = factor(group.x, levels = temp_groups),
    group.y = factor(group.y, levels = temp_groups)
  )

temp_labels <- temp %>%
  group_by(group.x, group.y) %>%
  summarise(n = n())

p <- ggplot(temp, aes(nUMI.x, nUMI.y)) +
  geom_point(size = 0.2) +
  geom_abline(intercept = 0, slope = 1, color = 'red') +
  geom_text(
    data = temp_labels, hjust = 0, size = 3,
    aes(x = 5E2, y = 7E4, label = paste0('n = ', format(n, big.mark = ',')))
  ) +
  scale_x_log10(
    name = 'Number of transcripts', breaks = c(1E2,1E3,1E4,1E5,1E6),
    labels = scales::trans_format('log10', scales::math_format(10^.x))
  ) +
  scale_y_log10(
    name = 'Number of transcripts', breaks = c(1E2,1E3,1E4,1E5,1E6),
    labels = scales::trans_format('log10', scales::math_format(10^.x))
  ) +
  annotation_logticks(side = 'bl') +
  theme_bw() +
  coord_fixed() +
  theme(
    panel.grid.minor = element_blank(),
    strip.text = element_text(face = 'bold', size = 10)
  ) +
  facet_grid(group.y ~ group.x)

ggsave(
  'results/pbmc_10k_v3/plots/correlation_cells_number_of_transcripts_1.png',
  p,
  height = 10, width = 10
)

p <- ggplot(temp, aes(nUMI.x, nUMI.y)) +
  stat_density_2d(aes(fill = stat(level)), geom = 'polygon') +
  geom_abline(intercept = 0, slope = 1, color = 'red') +
  scale_x_log10(
    name = 'Number of transcripts', breaks = c(1E2,1E3,1E4,1E5,1E6),
    labels = scales::trans_format('log10', scales::math_format(10^.x))
  ) +
  scale_y_log10(
    name = 'Number of transcripts', breaks = c(1E2,1E3,1E4,1E5,1E6),
    labels = scales::trans_format('log10', scales::math_format(10^.x))
  ) +
  scale_fill_viridis() +
  annotation_logticks(side = 'bl') +
  theme_bw() +
  coord_fixed() +
  theme(
    legend.position = 'none',
    panel.grid.minor = element_blank(),
    strip.text = element_text(face = 'bold', size = 10)
  ) +
  facet_grid(group.y ~ group.x)

ggsave(
  'results/pbmc_10k_v3/plots/correlation_cells_number_of_transcripts_2.png',
  p,
  height = 10, width = 10
)
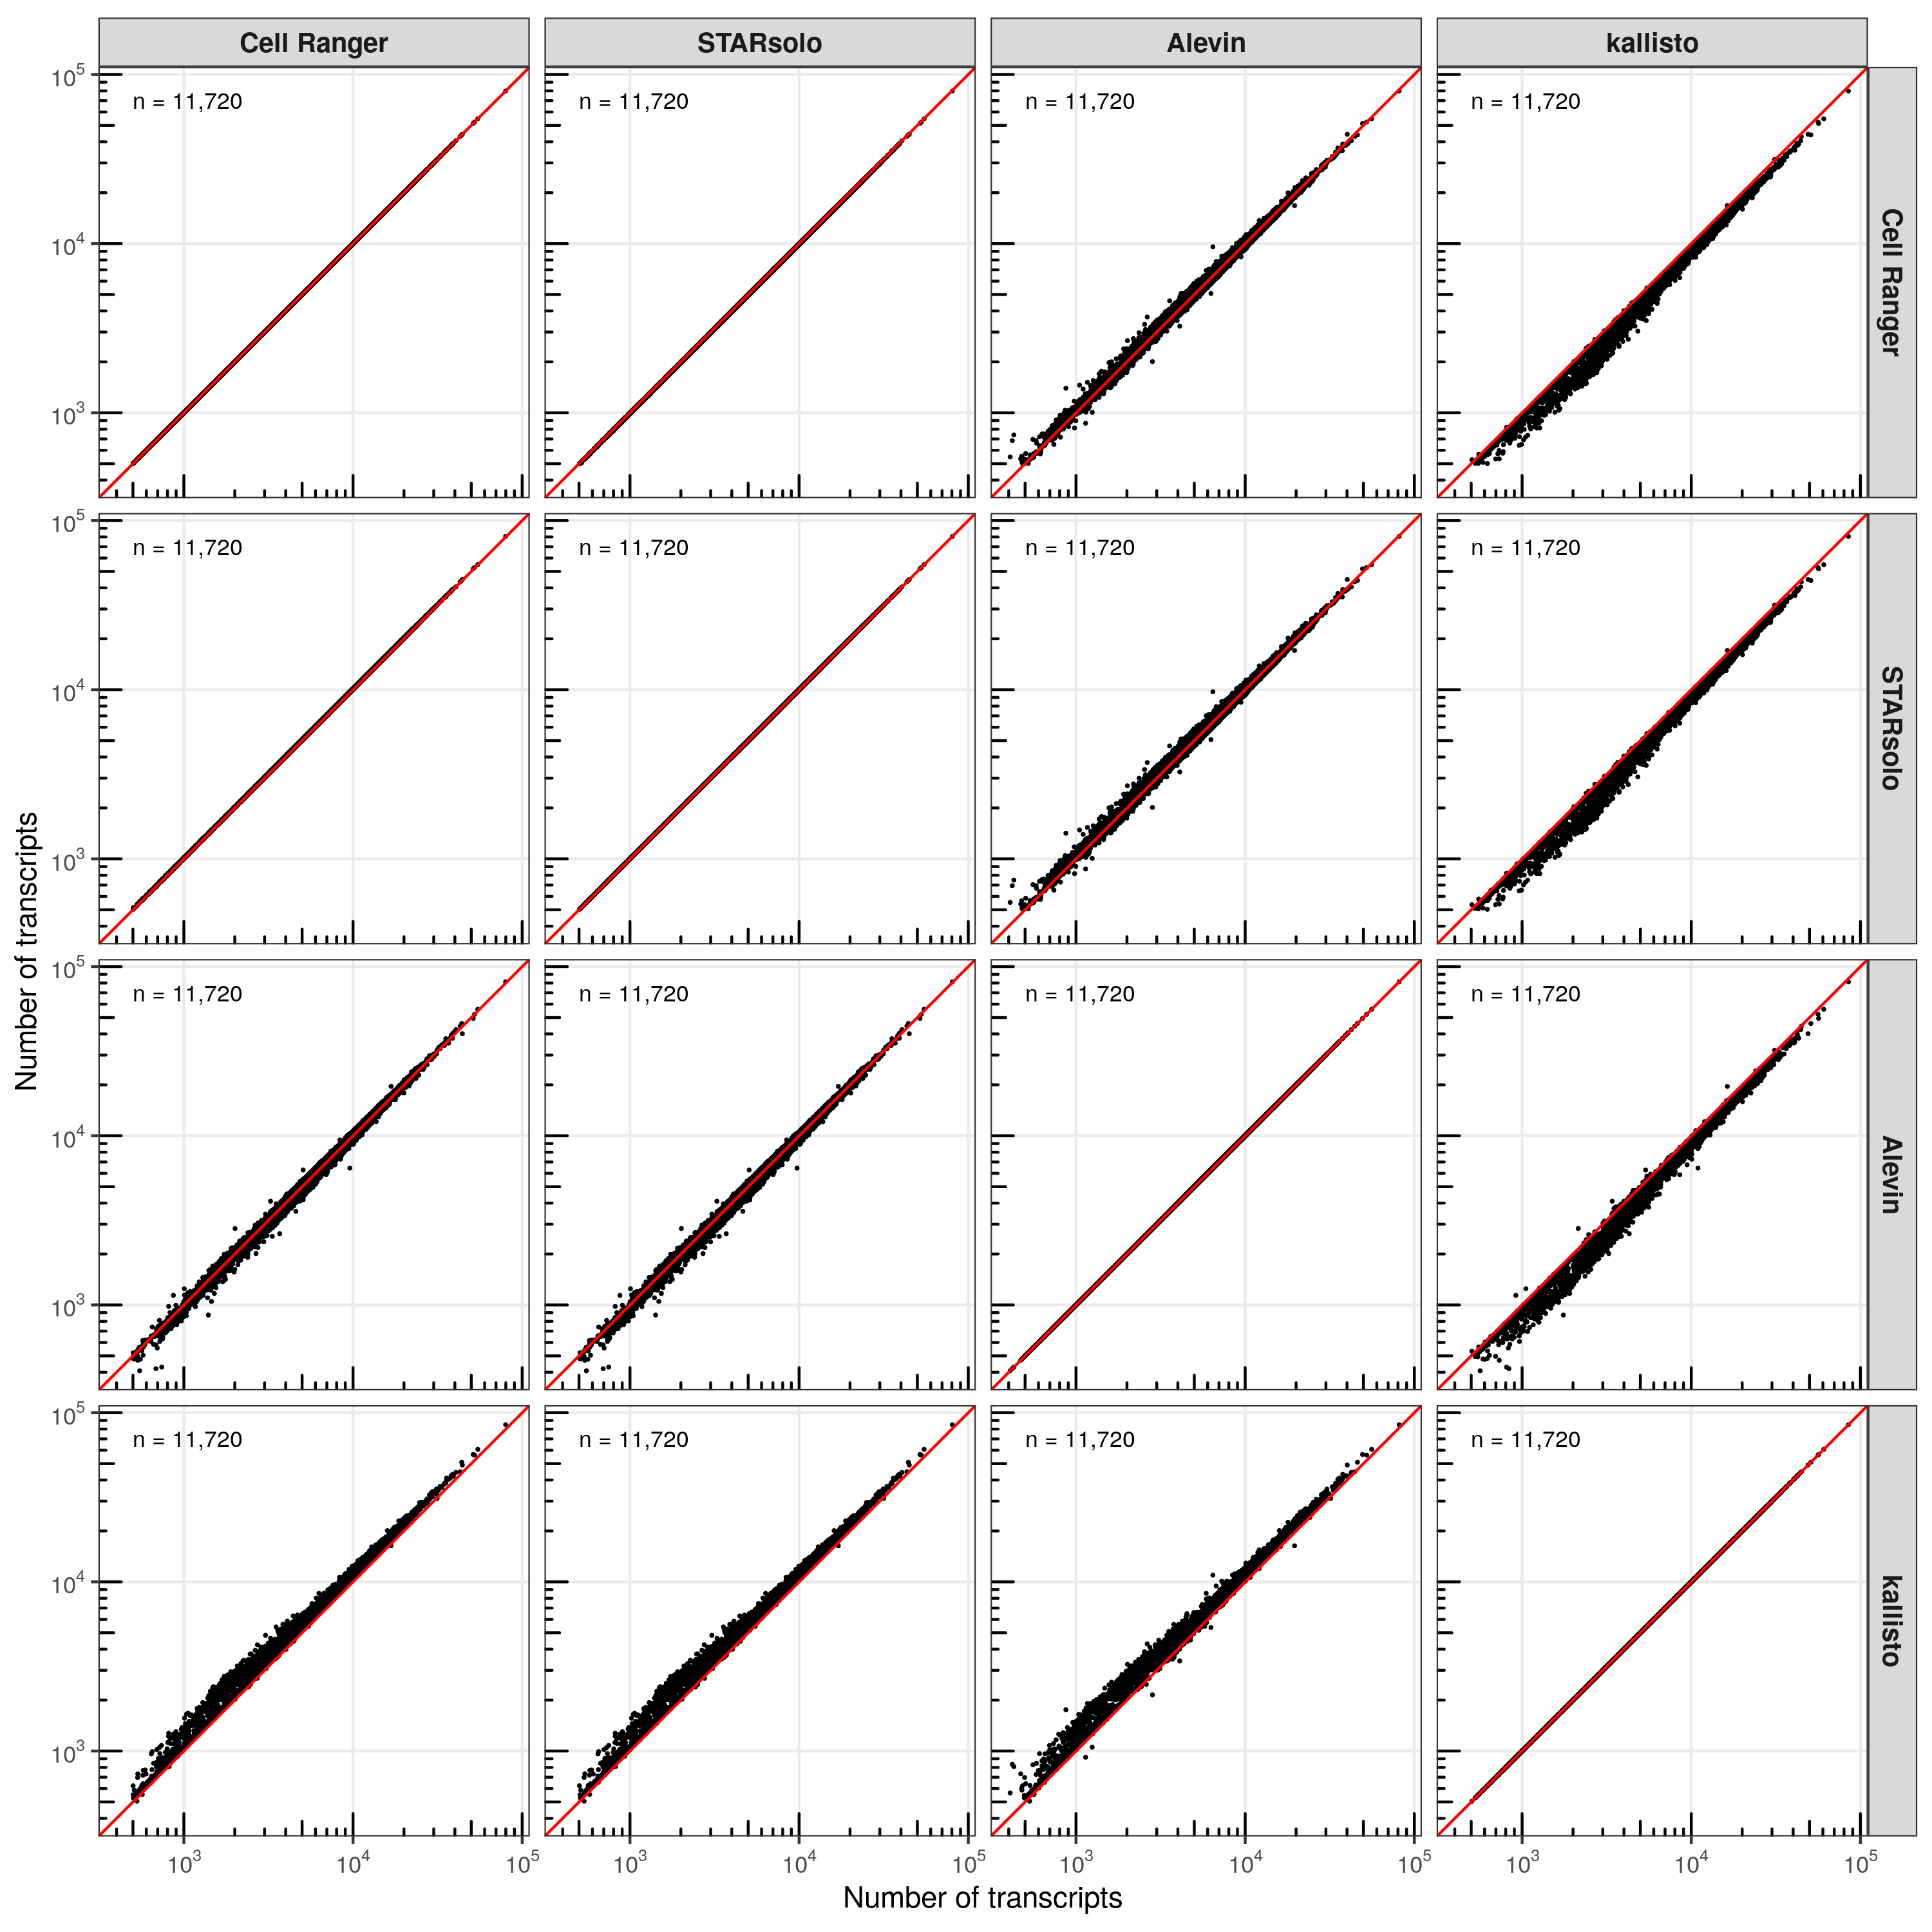
In most comparisons, the cells are distributed closely along the diagonal line (perfect correlation). However, consistent with the higher number of transcripts identified by kallisto, the majority of cells are located above the diagonal line, meaning that kallisto identified more transcripts evenly across all cells.
Number of expressed genes
Next, we checked the number of expressed genes (at least 1 transcript) across the cells.
temp_groups <- c('Cell Ranger', 'STARsolo', 'Alevin', 'kallisto')

temp <- tibble(
  group.x = character(),
  group.y = character(),
  nGene.x = numeric(),
  nGene.y = numeric()
)

for ( i in temp_groups ) {
  for ( j in temp_groups ) {
    ## assign correct name to group 1
    if ( i == 'Cell Ranger' ) {
      temp_group_1 <- 'Cell Ranger (filtered barcodes)'
    } else if ( i == 'STARsolo' ) {
      temp_group_1 <- 'STARsolo (Cell Ranger whitelist)'
    } else if ( i == 'Alevin' ) {
      temp_group_1 <- 'Alevin (Cell Ranger whitelist)'
    } else if ( i == 'kallisto' ) {
      temp_group_1 <- 'kallisto (Cell Ranger whitelist)'
    }
    ## assign correct name to group 2
    if ( j == 'Cell Ranger' ) {
      temp_group_2 <- 'Cell Ranger (filtered barcodes)'
    } else if ( j == 'STARsolo' ) {
      temp_group_2 <- 'STARsolo (Cell Ranger whitelist)'
    } else if ( j == 'Alevin' ) {
      temp_group_2 <- 'Alevin (Cell Ranger whitelist)'
    } else if ( j == 'kallisto' ) {
      temp_group_2 <- 'kallisto (Cell Ranger whitelist)'
    }
    ##
    temp <- bind_rows(
      temp,
      full_join(
        meta_data_cells %>% filter(group == temp_group_1) %>% select(cell, nGene),
        meta_data_cells %>% filter(group == temp_group_2) %>% select(cell, nGene),
        by = 'cell'
      ) %>%
      mutate(group.x = i, group.y = j)
    )
  }
}

temp <- temp %>%
  mutate(
    group.x = factor(group.x, levels = temp_groups),
    group.y = factor(group.y, levels = temp_groups)
  )

temp_labels <- temp %>%
  group_by(group.x, group.y) %>%
  summarise(n = n())

p <- ggplot(temp, aes(nGene.x, nGene.y)) +
  geom_point(size = 0.2) +
  geom_abline(intercept = 0, slope = 1, color = 'red') +
  geom_text(
    data = temp_labels, hjust = 0, size = 3,
    aes(x = 9E1, y = 7E3, label = paste0('n = ', format(n, big.mark = ',')))
  ) +
  scale_x_log10(
    name = 'Number of expressed genes', breaks = c(1E2,1E3,1E4),
    labels = scales::trans_format('log10', scales::math_format(10^.x))
  ) +
  scale_y_log10(
    name = 'Number of expressed genes', breaks = c(1E2,1E3,1E4),
    labels = scales::trans_format('log10', scales::math_format(10^.x))
  ) +
  annotation_logticks(side = 'bl') +
  theme_bw() +
  coord_fixed() +
  theme(
    panel.grid.minor = element_blank(),
    strip.text = element_text(face = 'bold', size = 10)
  ) +
  facet_grid(group.y ~ group.x)

ggsave(
  'results/pbmc_10k_v3/plots/correlation_cells_number_of_expressed_genes.png',
  p,
  height = 10, width = 10
)
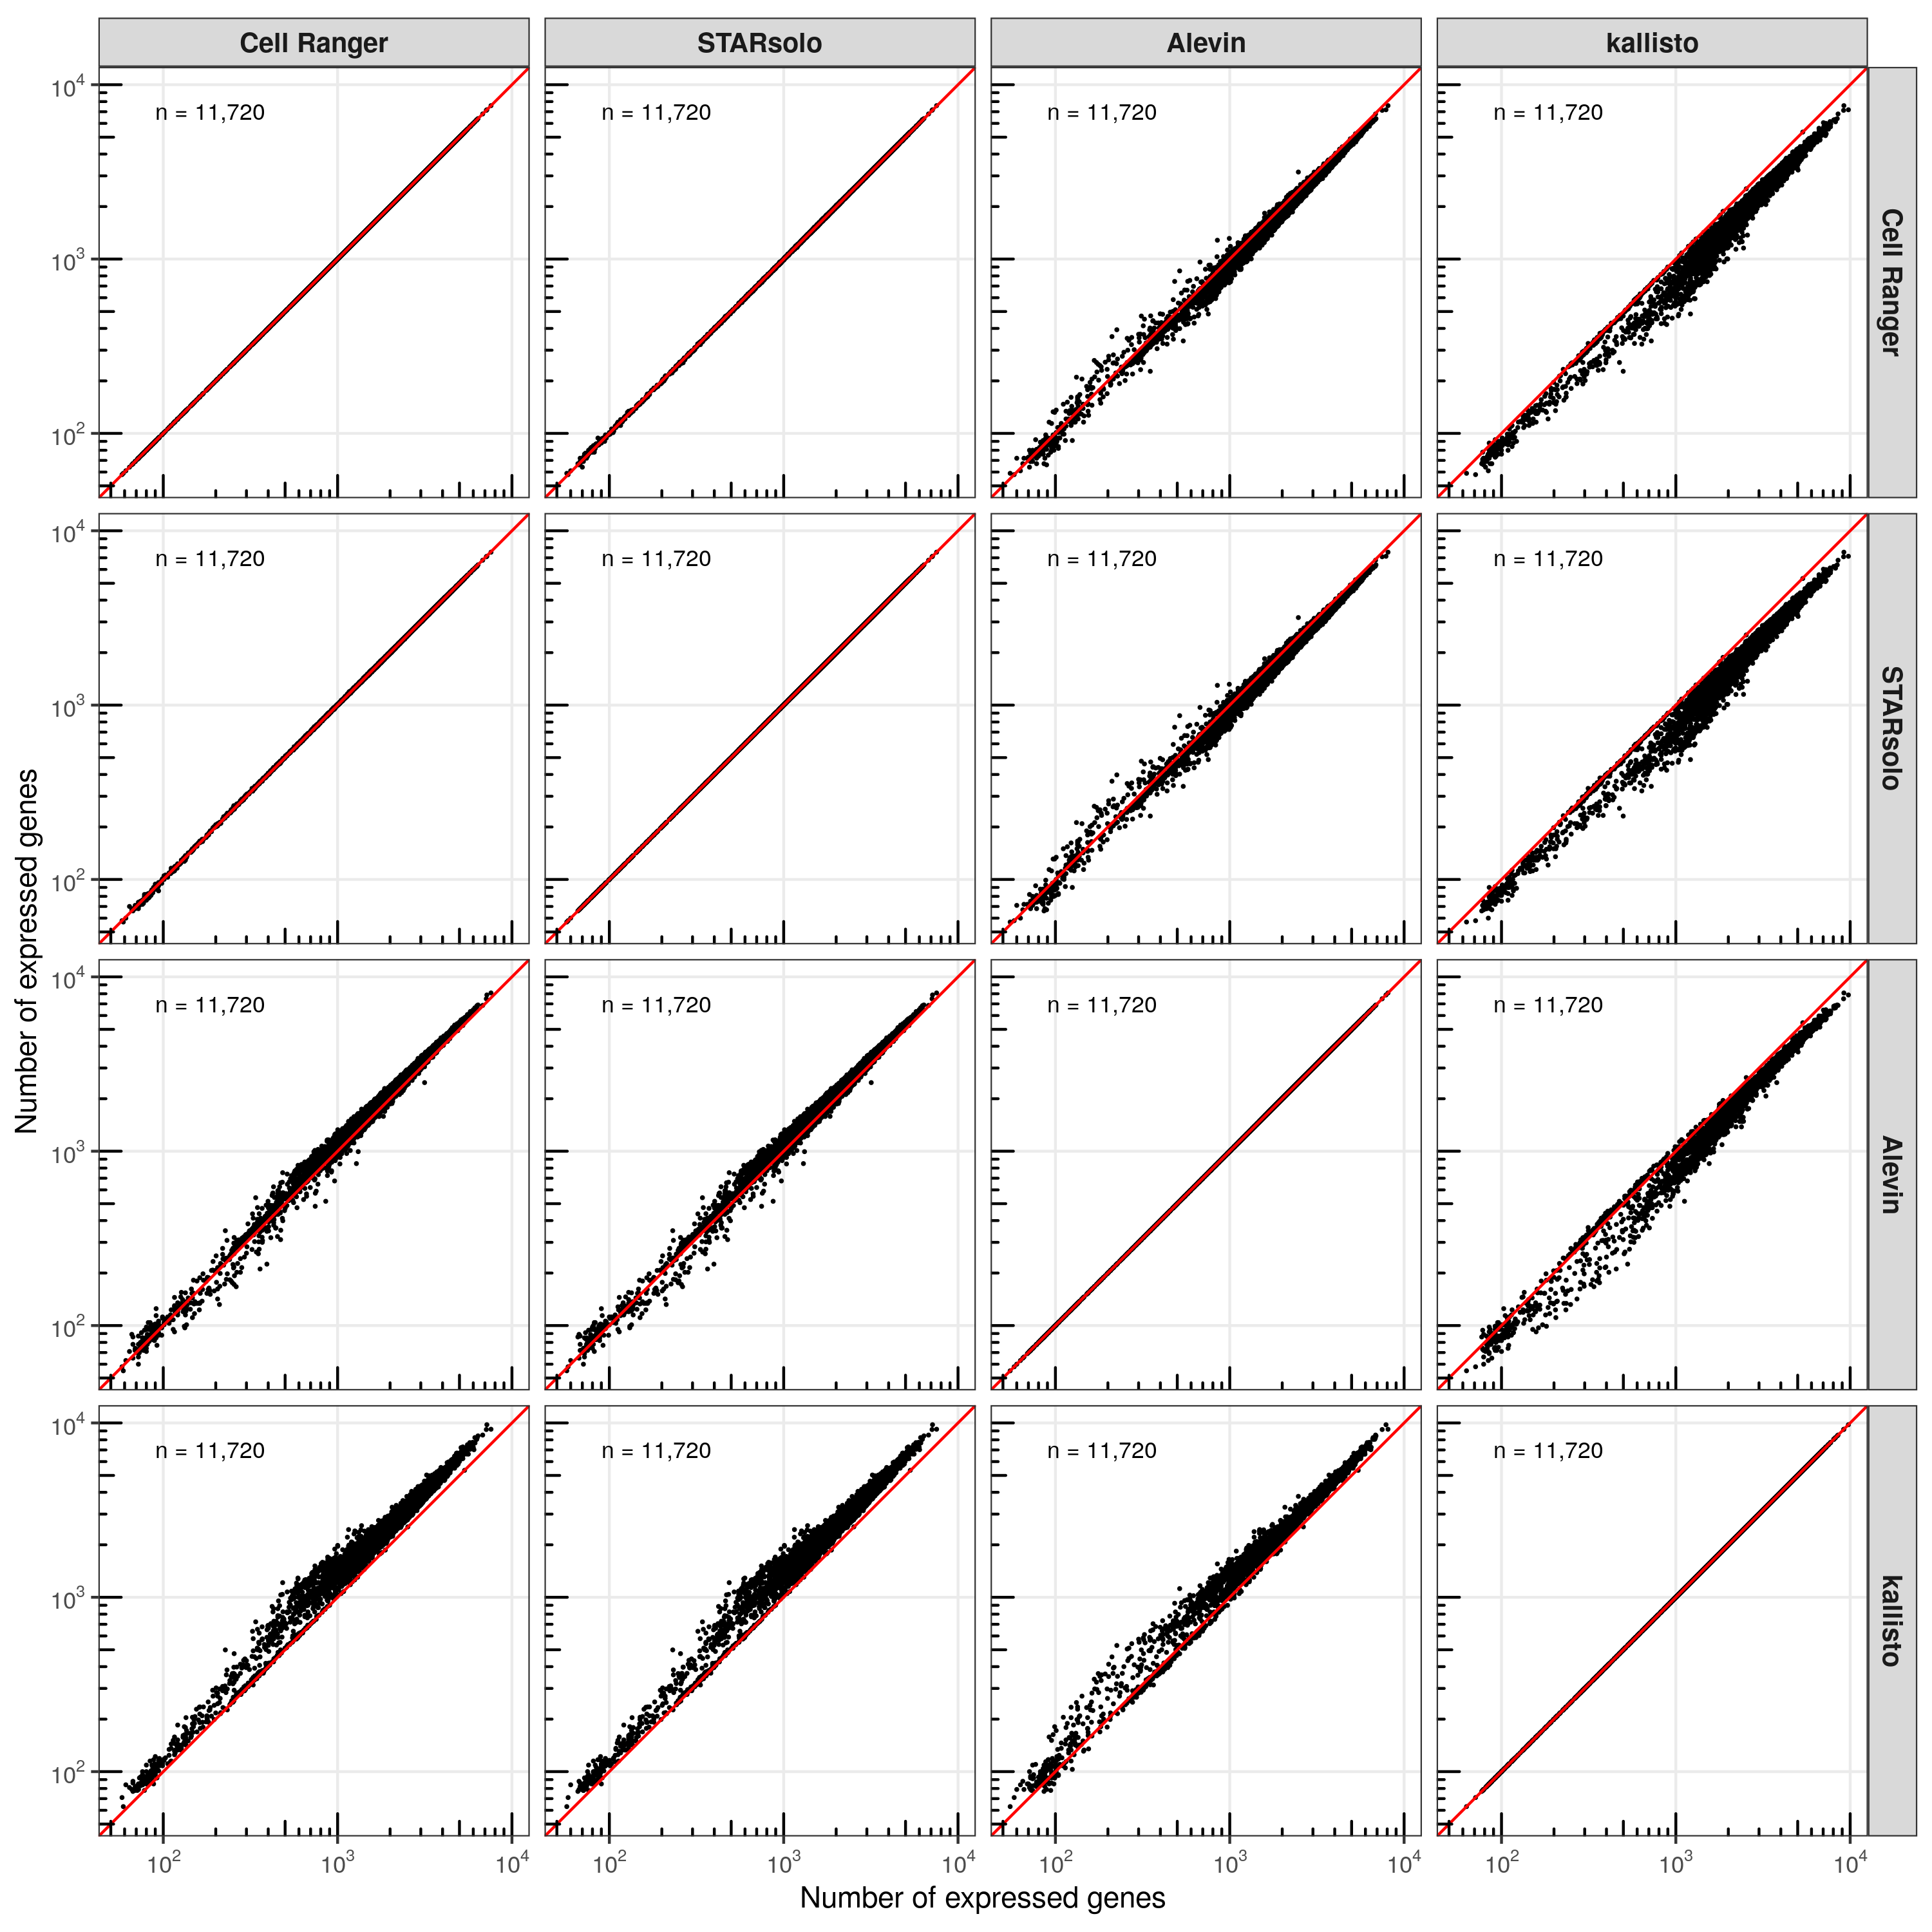
While Cell Ranger, STAR, and Alevin have comparable results, kallisto found more genes to be expressed in most cells.
Correlation of transcripts per gene
Here, we switch focus to genes instead of cells and ask how many transcripts were found for every gene between the tools.
temp_groups <- c('Cell Ranger', 'STARsolo', 'Alevin', 'kallisto')

temp_cell_ranger_filtered_barcodes <- tibble(
    gene = feature_matrix$cell_ranger_filtered_barcodes %>% rownames(),
    nUMI = feature_matrix$cell_ranger_filtered_barcodes %>% Matrix::rowSums()
  )

temp_starsolo_cell_ranger_whitelist <- tibble(
    gene = feature_matrix$starsolo_cell_ranger_whitelist %>% rownames(),
    nUMI = feature_matrix$starsolo_cell_ranger_whitelist %>% Matrix::rowSums()
  )

temp_alevin_cell_ranger_whitelist <- tibble(
    gene = feature_matrix$alevin_cell_ranger_whitelist %>% rownames(),
    nUMI = feature_matrix$alevin_cell_ranger_whitelist %>% Matrix::rowSums()
  )

temp_kallisto_cell_ranger_whitelist <- tibble(
    gene = feature_matrix$kallisto_cell_ranger_whitelist %>% rownames(),
    nUMI = feature_matrix$kallisto_cell_ranger_whitelist %>% Matrix::rowSums()
  )

temp <- tibble(
  group.x = character(),
  group.y = character(),
  nUMI.x = numeric(),
  nUMI.y = numeric()
)

for ( i in temp_groups ) {
  for ( j in temp_groups ) {
    ## assign correct name to group 1
    if ( i == 'Cell Ranger' ) {
      temp_group_1 <- temp_cell_ranger_filtered_barcodes
    } else if ( i == 'STARsolo' ) {
      temp_group_1 <- temp_starsolo_cell_ranger_whitelist
    } else if ( i == 'Alevin' ) {
      temp_group_1 <- temp_alevin_cell_ranger_whitelist
    } else if ( i == 'kallisto' ) {
      temp_group_1 <- temp_kallisto_cell_ranger_whitelist
    }
    ## assign correct name to group 2
    if ( j == 'Cell Ranger' ) {
      temp_group_2 <- temp_cell_ranger_filtered_barcodes
    } else if ( j == 'STARsolo' ) {
      temp_group_2 <- temp_starsolo_cell_ranger_whitelist
    } else if ( j == 'Alevin' ) {
      temp_group_2 <- temp_alevin_cell_ranger_whitelist
    } else if ( j == 'kallisto' ) {
      temp_group_2 <- temp_kallisto_cell_ranger_whitelist
    }
    ##
    temp <- bind_rows(
      temp,
      full_join(
        temp_group_1,
        temp_group_2,
        by = 'gene'
      ) %>%
      replace_na(list(nUMI.x = 0.1, nUMI.y = 0.1)) %>%
      mutate(
        nUMI.x = ifelse(nUMI.x < 0.1, 0.1, nUMI.x),
        nUMI.y = ifelse(nUMI.y < 0.1, 0.1, nUMI.y),
        group.x = i, group.y = j
      )
    )
  }
}

temp <- temp %>%
  mutate(
    group.x = factor(group.x, levels = temp_groups),
    group.y = factor(group.y, levels = temp_groups)
  )

temp_labels <- temp %>%
  group_by(group.x, group.y) %>%
  summarise(n = n())

p <- ggplot(temp, aes(nUMI.x, nUMI.y)) +
  geom_point(size = 0.5, alpha = 0.5) +
  geom_abline(intercept = 0, slope = 1, color = 'red') +
  geom_text(
    data = temp_labels, hjust = 0, size = 3,
    aes(x = 5E-1, y = 3E6, label = paste0('n = ', format(n, big.mark = ',')))
  ) +
  scale_x_log10(
    name = 'Number of transcripts', breaks = c(1E-1,1E0,1E1,1E2,1E3,1E4,1E5,1E6),
    labels = scales::trans_format('log10', scales::math_format(10^.x))
  ) +
  scale_y_log10(
    name = 'Number of transcripts', breaks = c(1E-1,1E0,1E1,1E2,1E3,1E4,1E5,1E6),
    labels = scales::trans_format('log10', scales::math_format(10^.x))
  ) +
  annotation_logticks(side = 'bl') +
  theme_bw() +
  coord_fixed() +
  theme(
    panel.grid.minor = element_blank(),
    strip.text = element_text(face = 'bold', size = 10)
  ) +
  facet_grid(group.y ~ group.x)

ggsave(
  'results/pbmc_10k_v3/plots/correlation_genes_number_of_transcripts.png',
  p, height = 10, width = 10
)
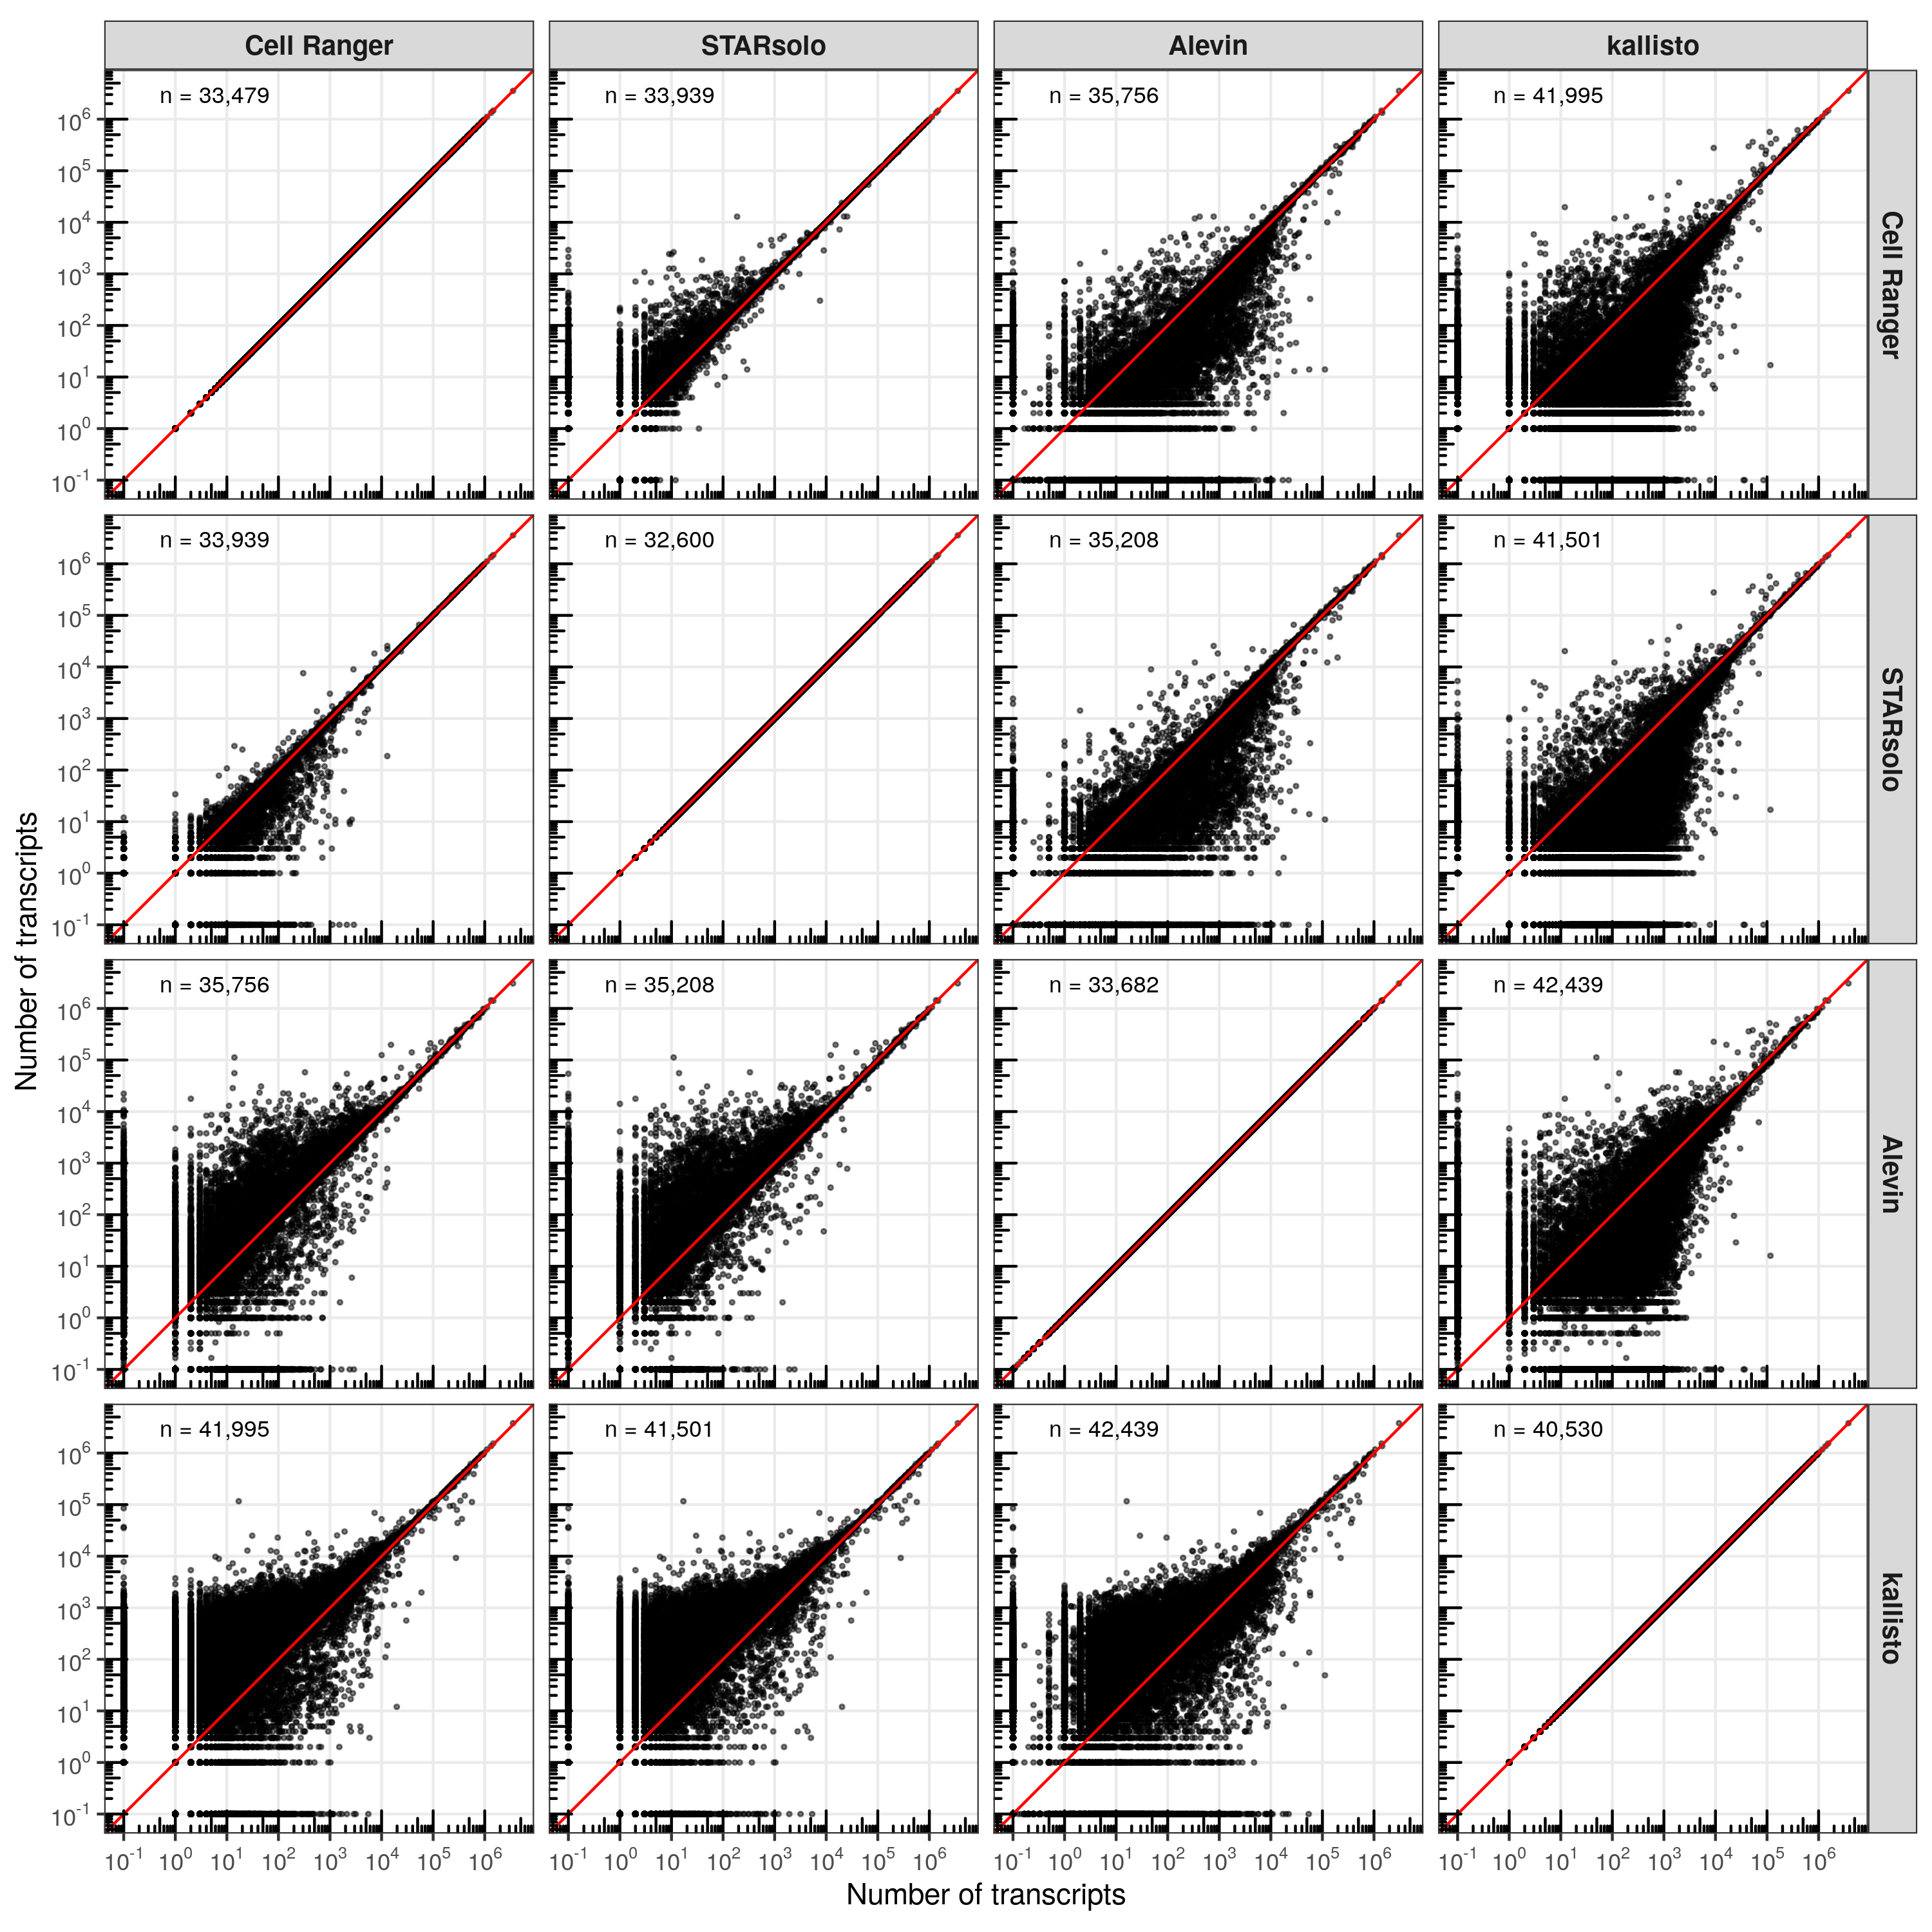
NOTE: Genes with zero counts or counts lower than 0.1 were manually set to 0.1 to fit them in the scale.
The results here are more diverse than for the cells. While the scatter plot might indicate that many genes have drastically different transcript counts between the tools, the majority is actually located along the diagonal. Interestingly, despite the higher number of genes detected by kallisto compared to the other tools, some genes were identified in the other tools but not in kallisto. While genes with very high counts are more consistently quantified between the tools, some genes show large discrepancies, with zero counts in one tools and more than 10,000 in another.
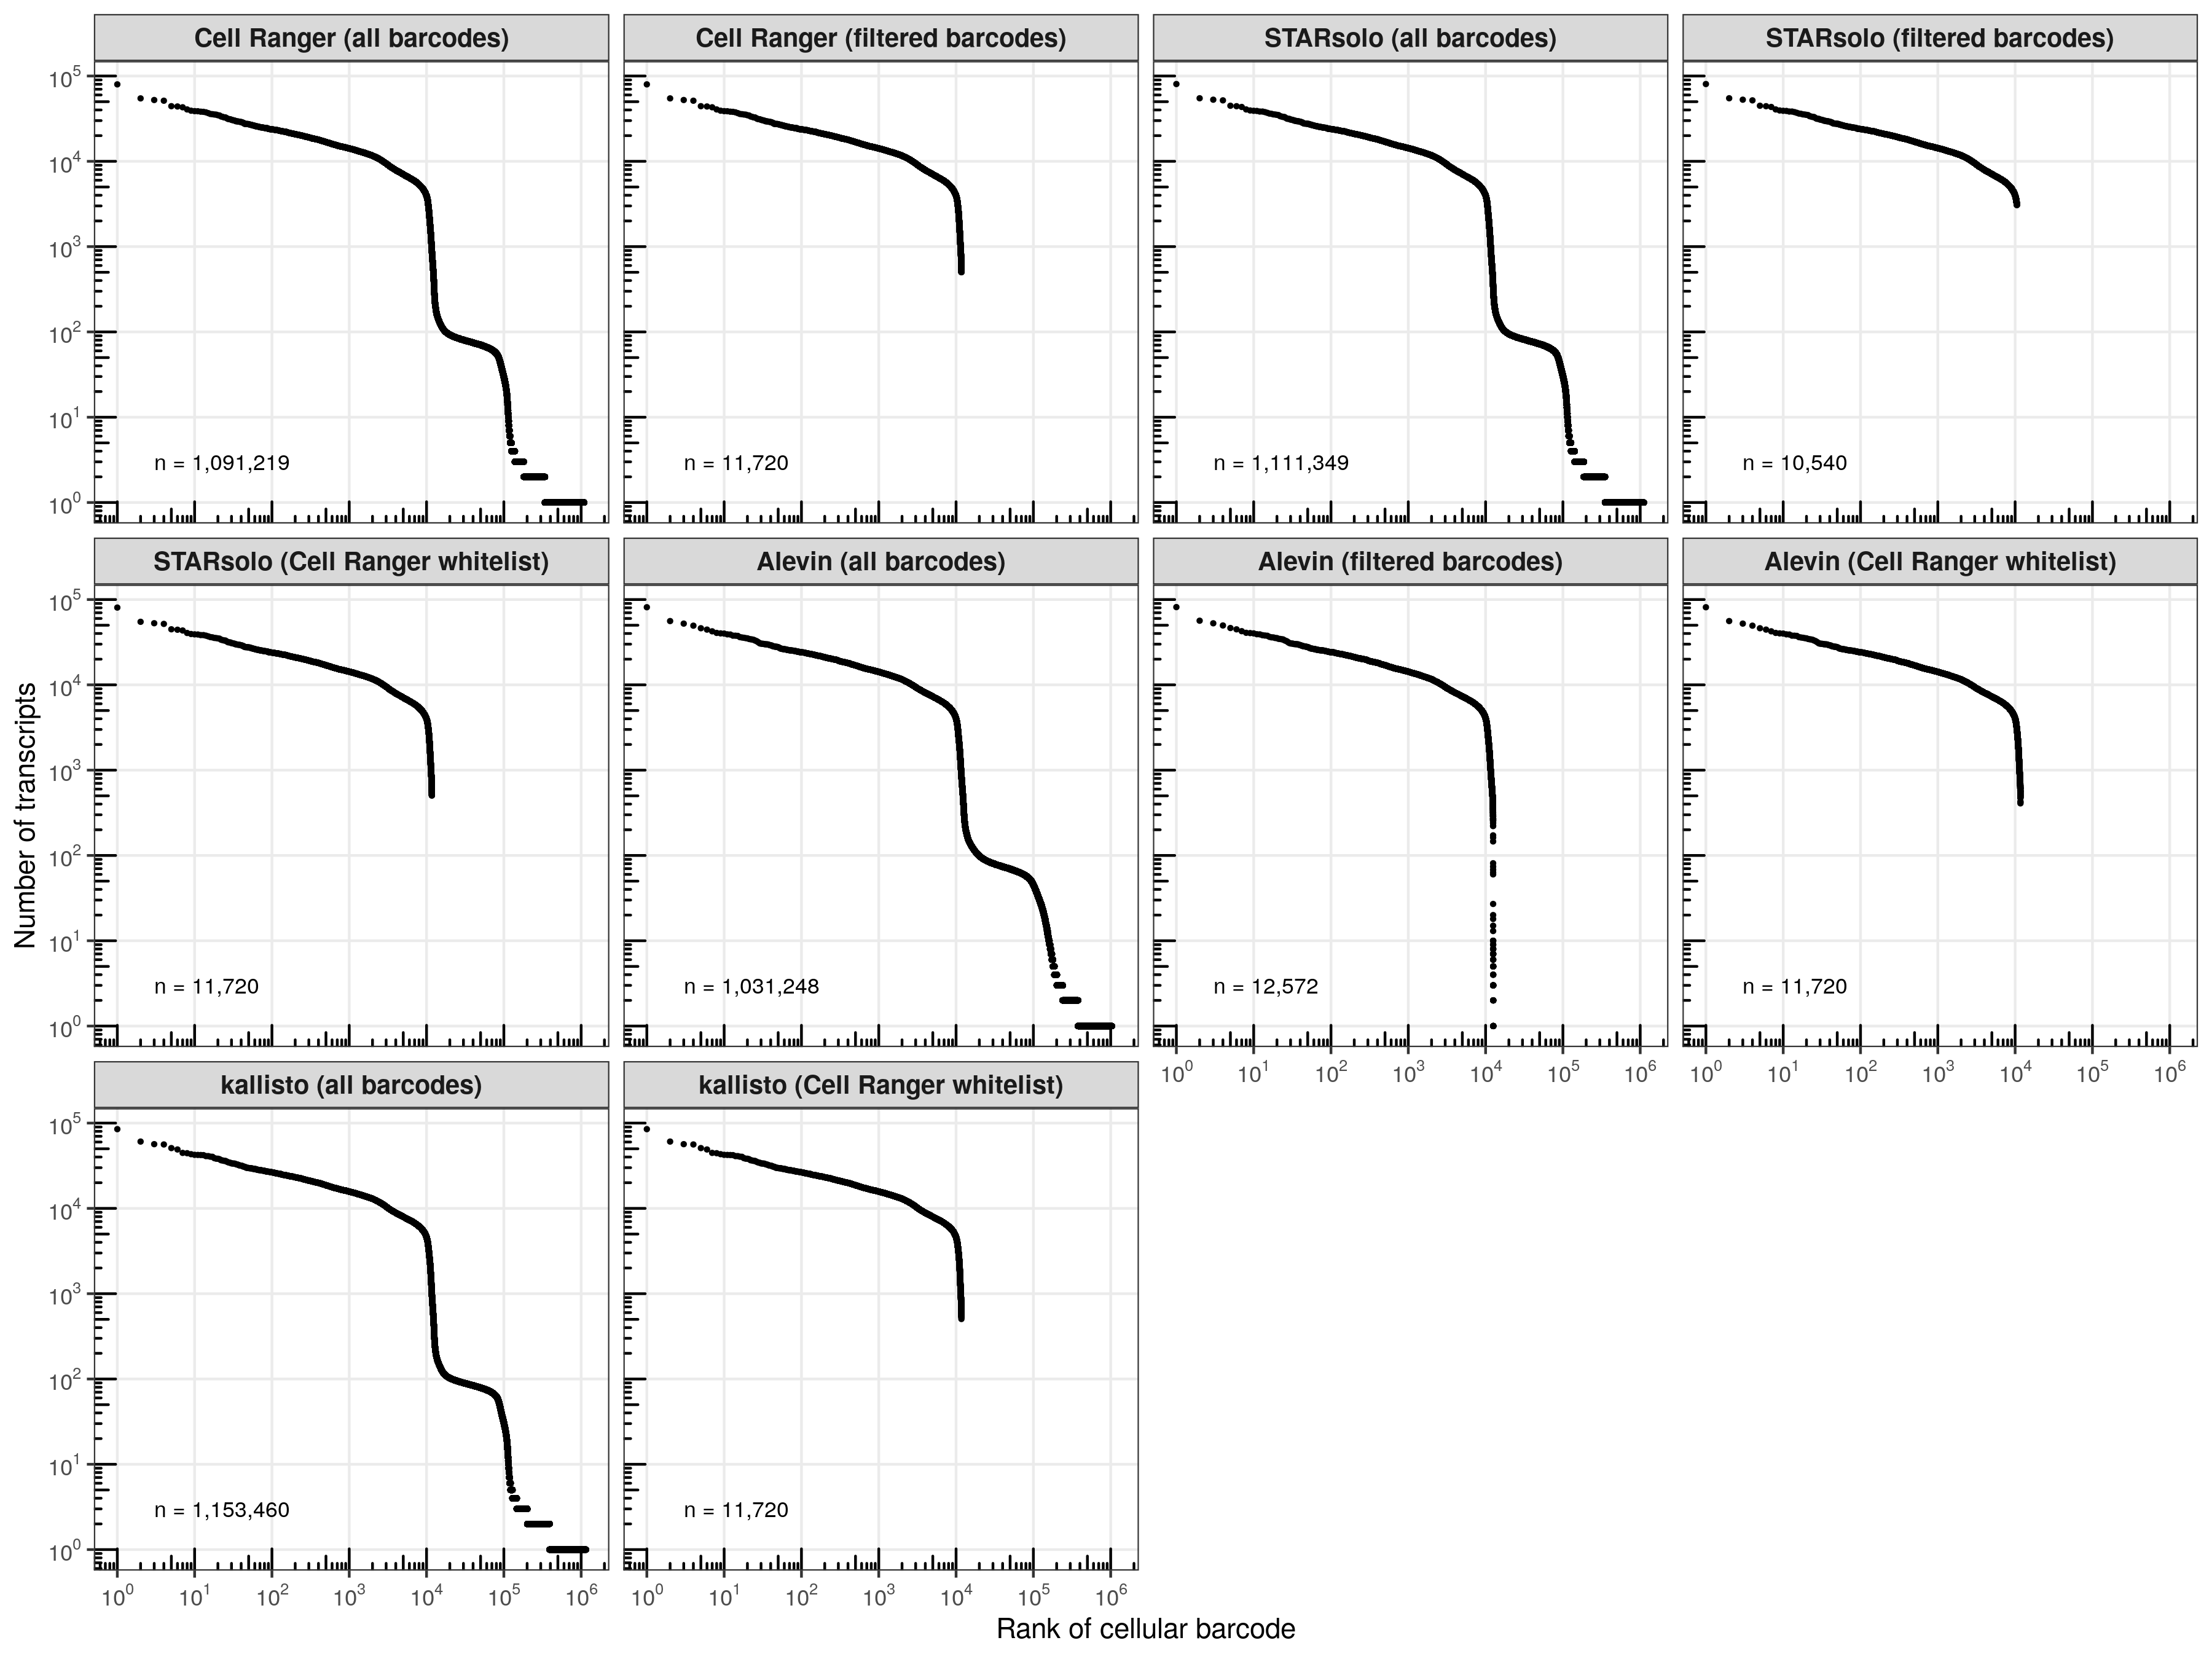
Knee plots
temp_labels <- meta_data_cells %>%
  group_by(group) %>%
  summarise(n = n())

p <- meta_data_cells %>%
  ggplot(aes(rank, nUMI)) +
  geom_point(size = 0.5) +
  geom_text(
    data = temp_labels, hjust = 0, size = 3,
    aes(x = 3E0, y = 3E0, label = paste0('n = ', format(n, big.mark = ',', trim = TRUE)))
  ) +
  scale_x_log10(
    name = 'Rank of cellular barcode', breaks = c(1E0,1E1,1E2,1E3,1E4,1E5,1E6),
    labels = scales::trans_format('log10', scales::math_format(10^.x))
  ) +
  scale_y_log10(
    name = 'Number of transcripts', breaks = c(1E0,1E1,1E2,1E3,1E4,1E5),
    labels = scales::trans_format('log10', scales::math_format(10^.x))
  ) +
  annotation_logticks(side = 'bl') +
  theme_bw() +
  theme(
    panel.grid.minor = element_blank(),
    strip.text = element_text(face = 'bold', size = 10)
  ) +
  facet_wrap(~group, ncol = 4)
ggsave('results/pbmc_10k_v3/plots/knee_plots.png', p, height = 9, width = 12)
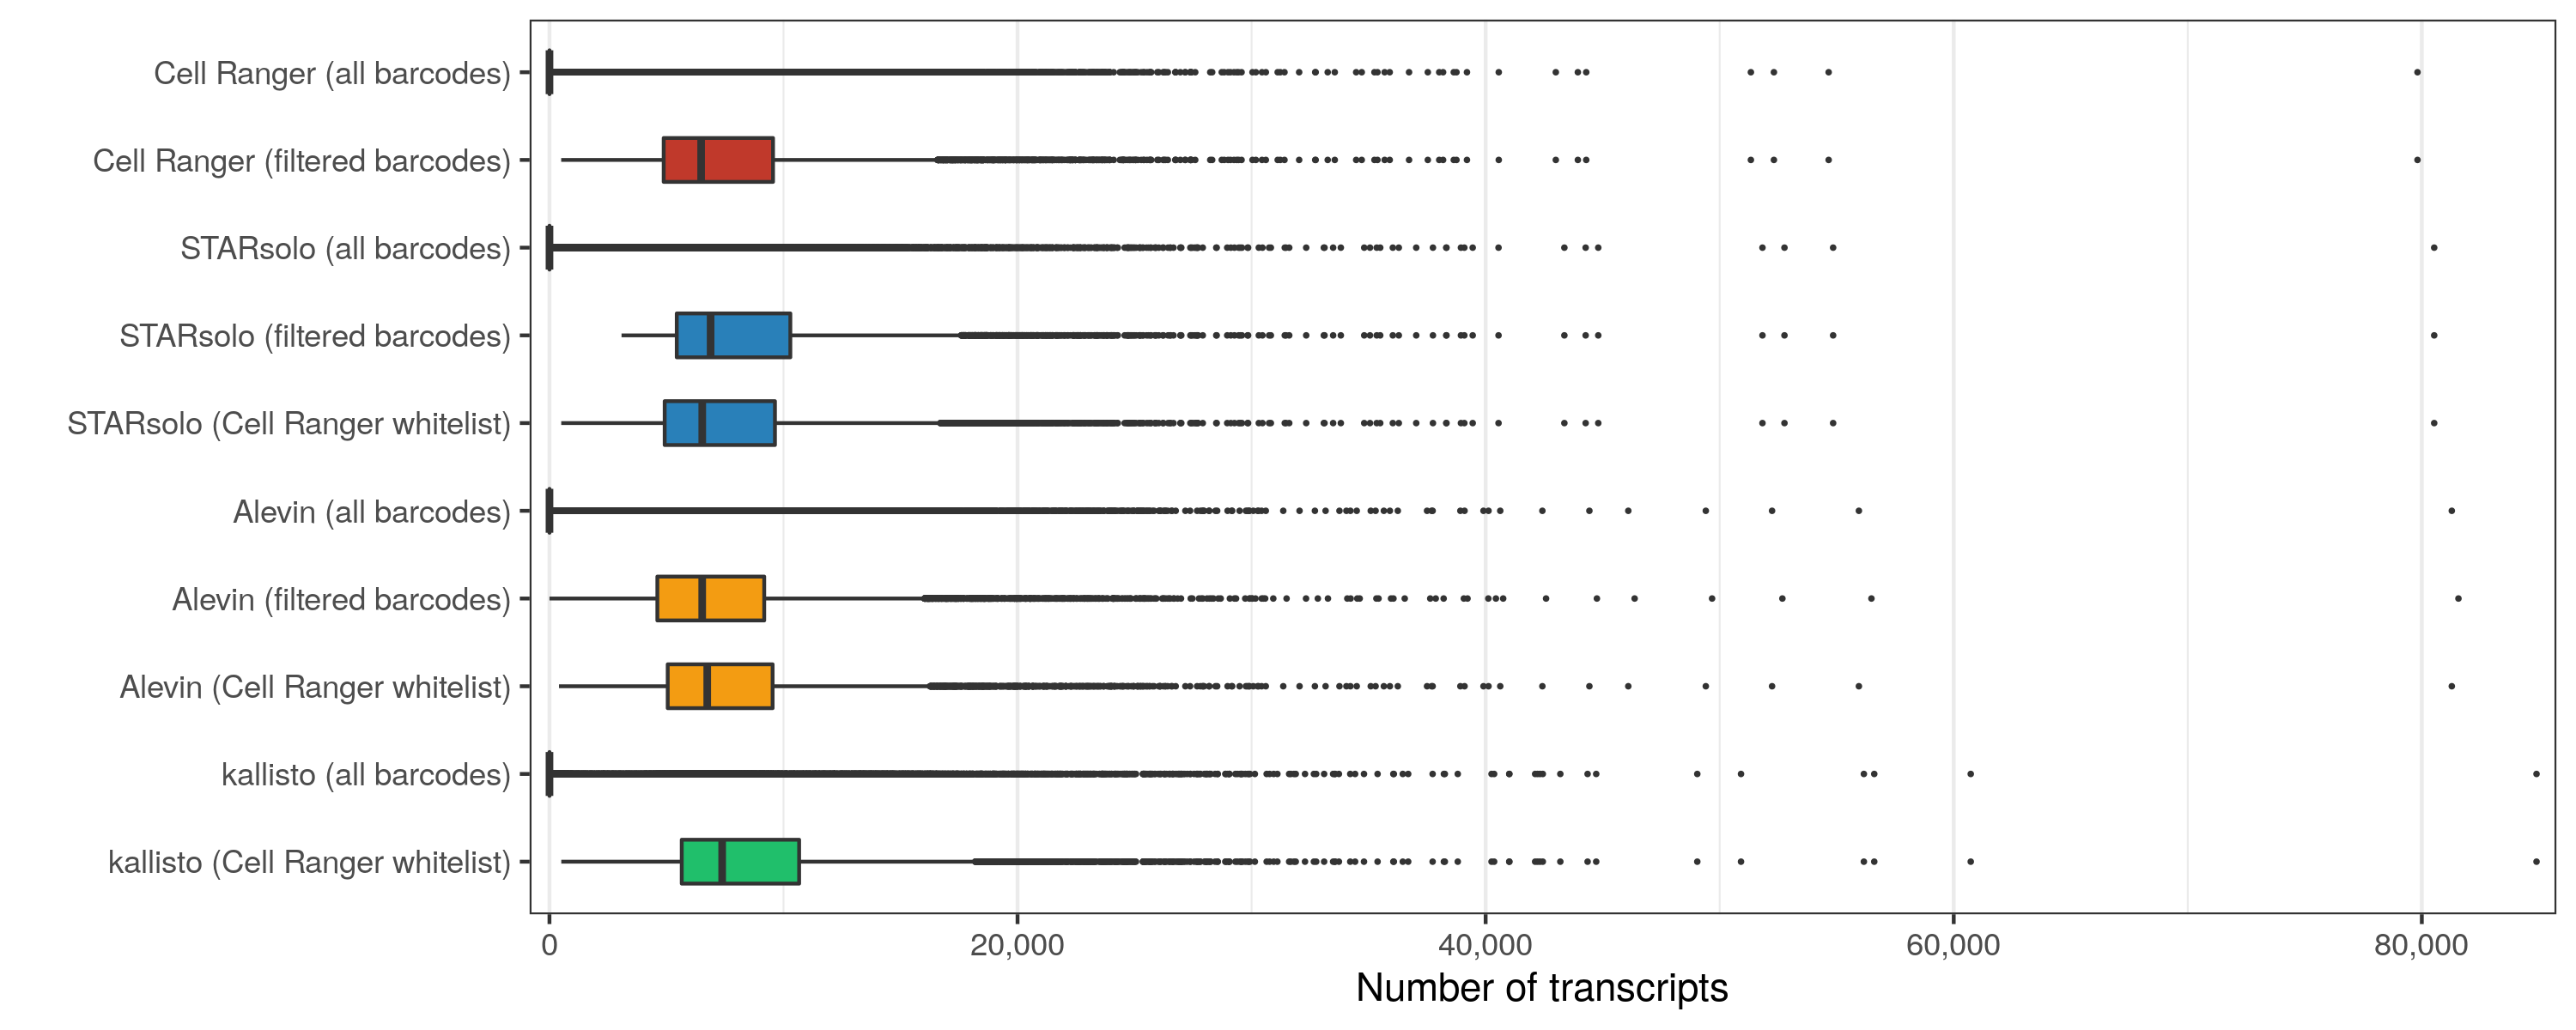
Transcripts per cell
p <- meta_data_cells %>%
  mutate(group = fct_rev(group)) %>%
  ggplot(aes(nUMI, group, fill = group)) +
  geom_boxplot(width = 0.5, outlier.size = 0.2) +
  scale_x_continuous(
    name = 'Number of transcripts', labels = scales::comma, expand = c(0.01, 0)
  ) +
  scale_y_discrete(name = '') +
  scale_fill_manual(values = color_assignments) +
  theme_bw() +
  theme(
    legend.position = 'none',
    panel.grid.major.y = element_blank()
  )
ggsave('results/pbmc_10k_v3/plots/distribution_transcripts_per_cell.png', p, height = 4, width = 10)
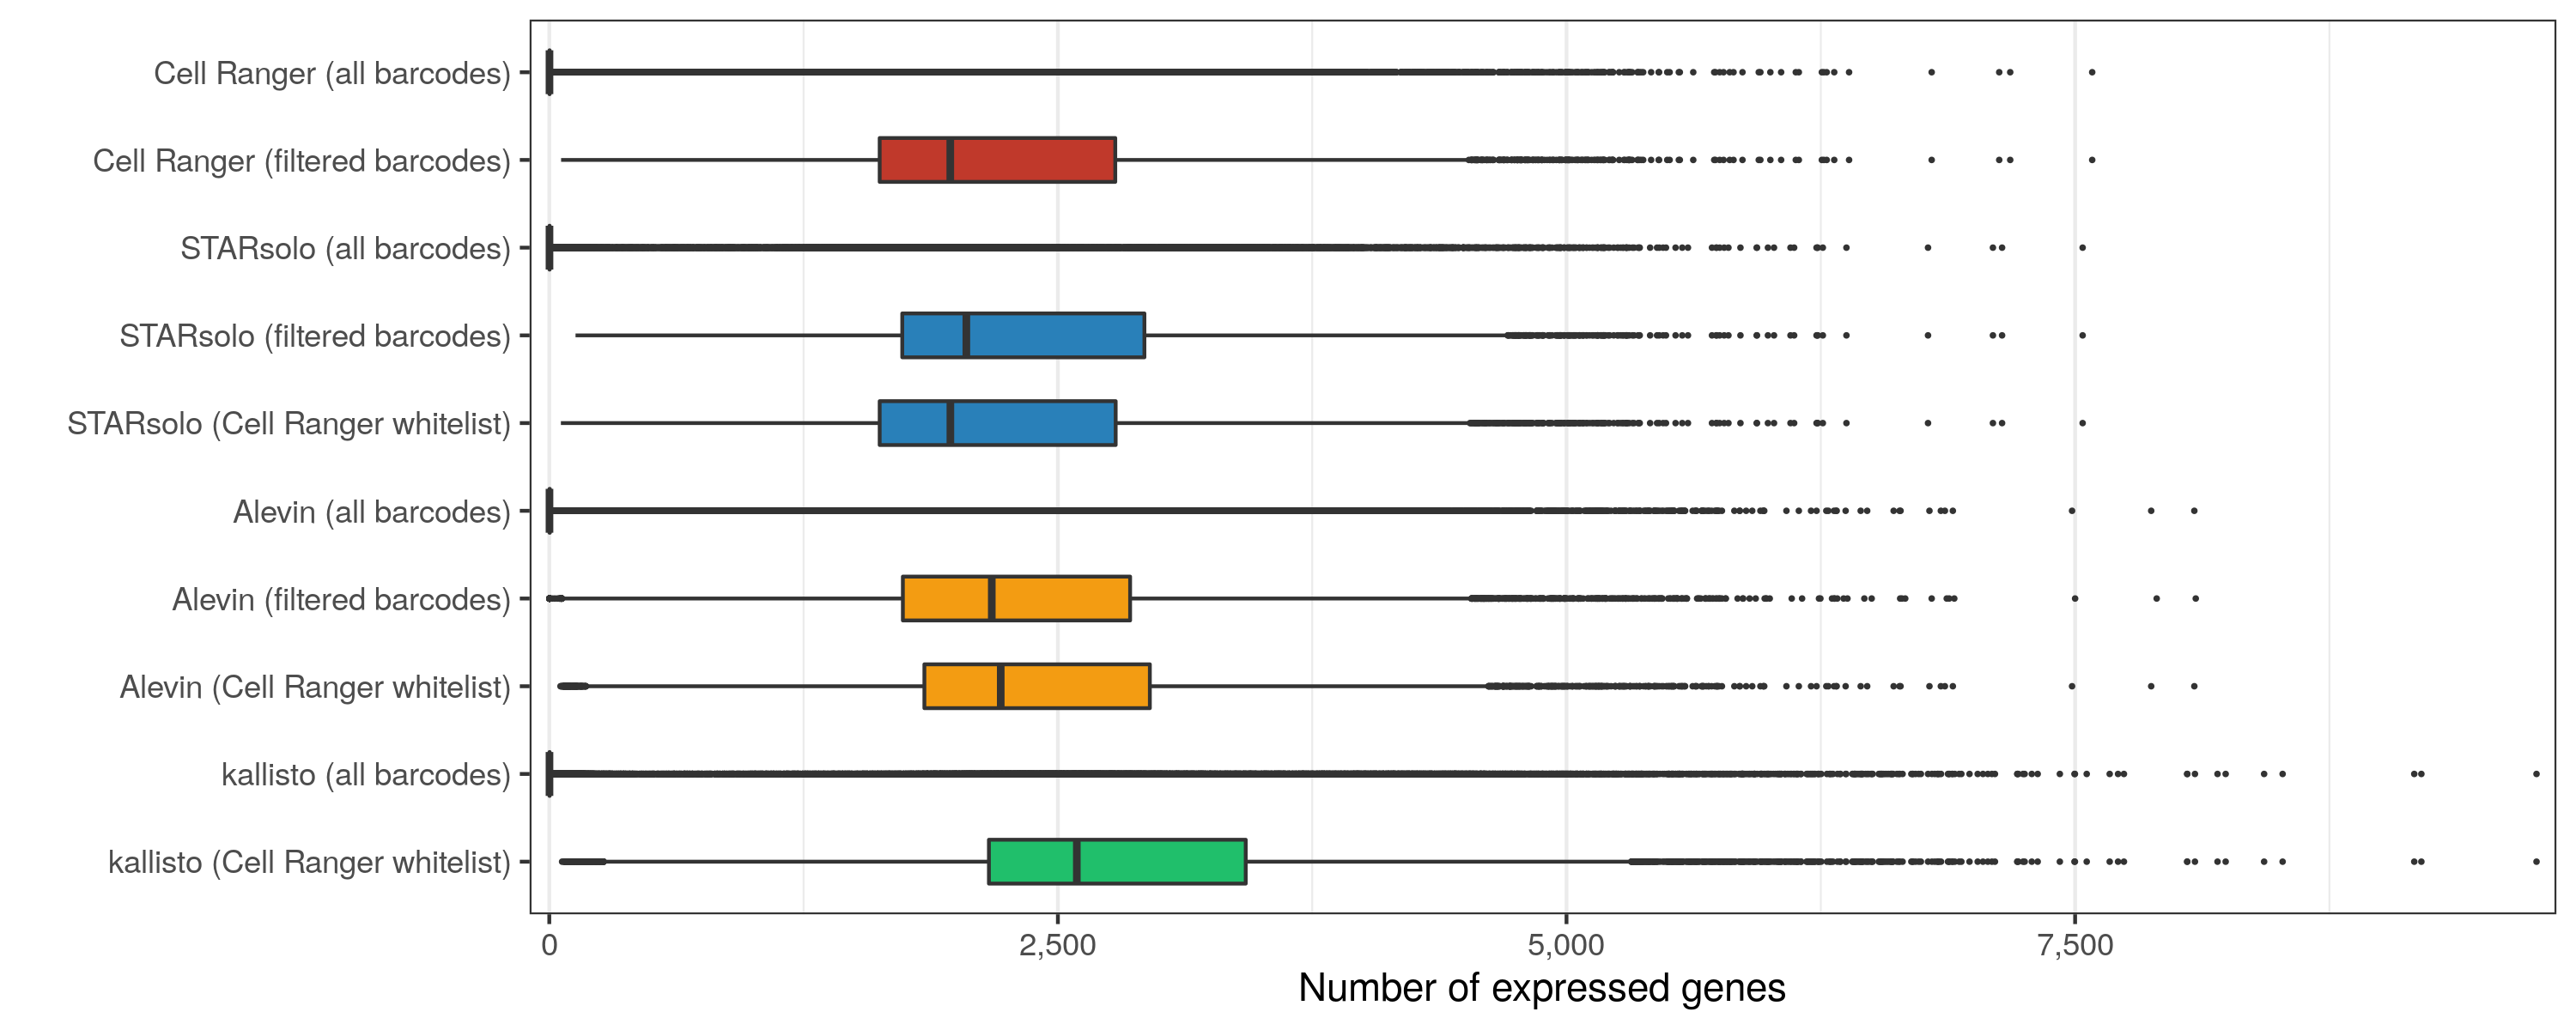
Expressed genes per cell
p <- meta_data_cells %>%
  mutate(group = fct_rev(group)) %>%
  ggplot(aes(nGene, group, fill = group)) +
  geom_boxplot(width = 0.5, outlier.size = 0.2) +
  scale_x_continuous(
    name = 'Number of expressed genes', labels = scales::comma, expand = c(0.01, 0)
  ) +
  scale_y_discrete(name = '') +
  scale_fill_manual(values = color_assignments) +
  theme_bw() +
  theme(
    legend.position = 'none',
    panel.grid.major.y = element_blank()
  )
ggsave('results/pbmc_10k_v3/plots/distribution_expressed_genes_per_cell.png', p, height = 4, width = 10)
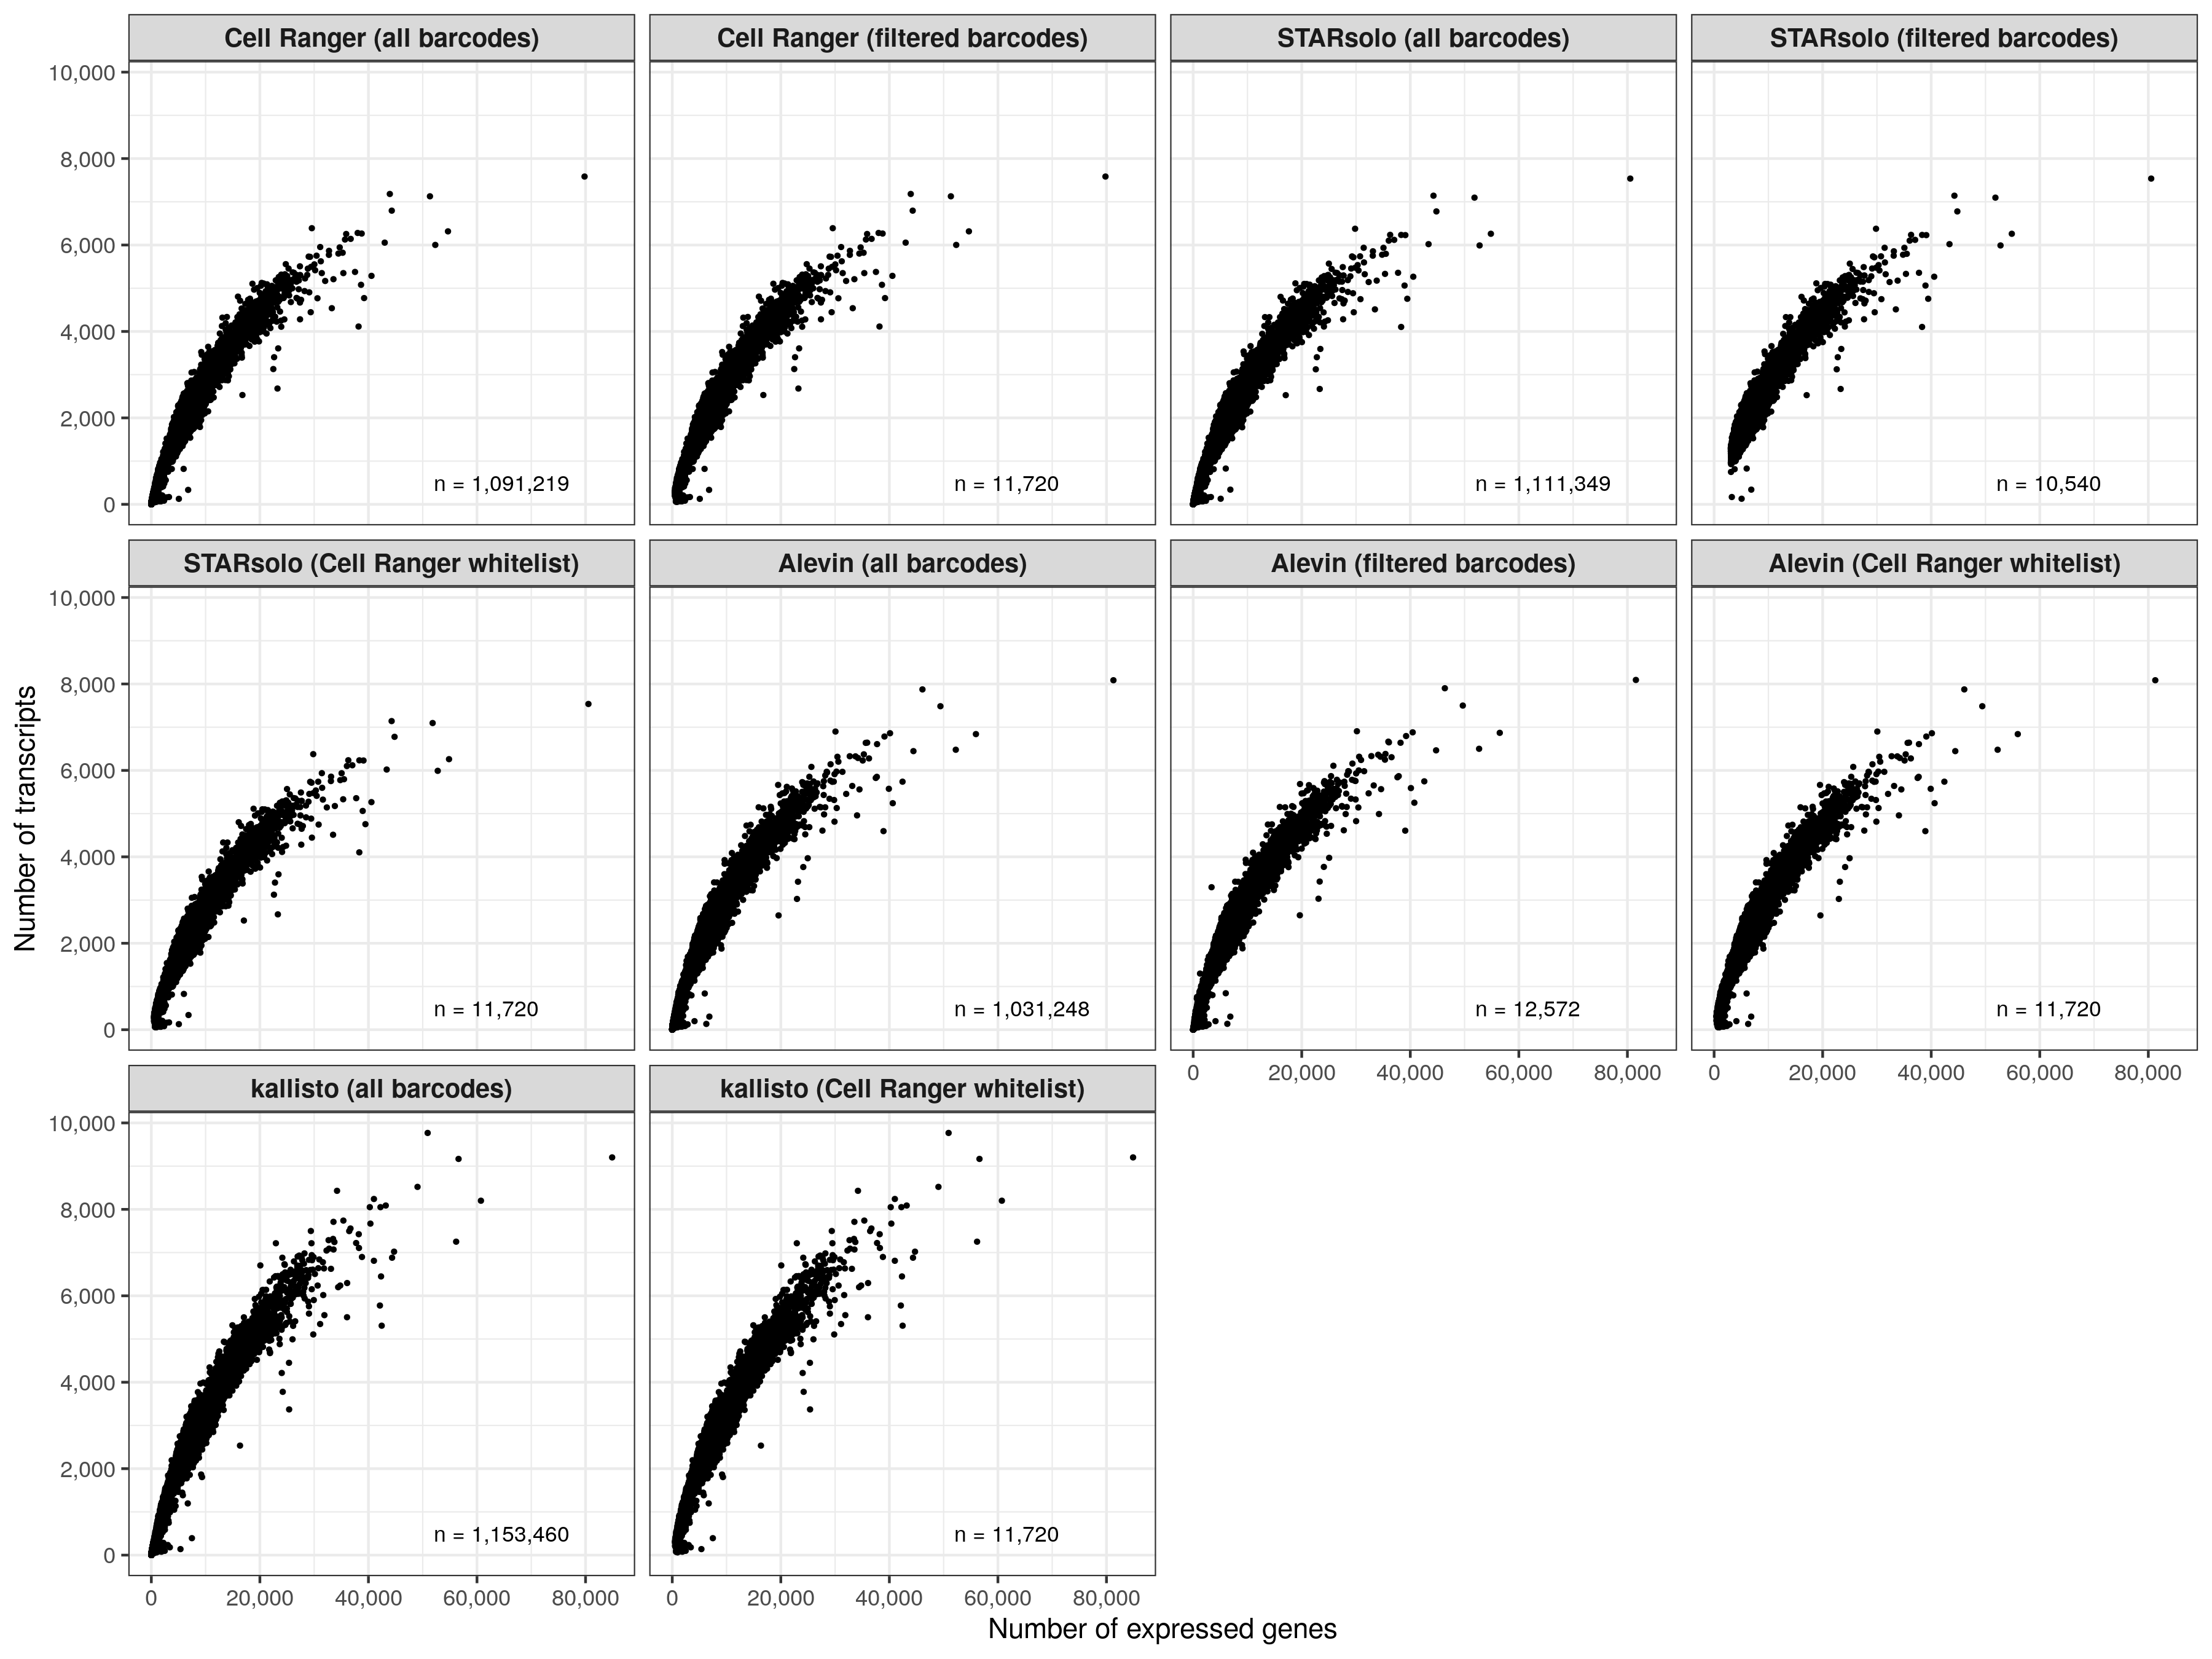
Number of expressed genes over number of transcripts (per cell)
temp_labels <- meta_data_cells %>%
  group_by(group) %>%
  summarise(n = n())

p <- meta_data_cells %>%
  ggplot(aes(nUMI, nGene)) +
  geom_point(size = 0.5) +
  geom_text(
    data = temp_labels, hjust = 0, size = 3,
    aes(x = 52000, y = 500, label = paste0('n = ', format(n, big.mark = ',', trim = TRUE)))
  ) +
  scale_x_continuous(name = 'Number of expressed genes', labels = scales::comma) +
  scale_y_continuous(
    name = 'Number of transcripts', labels = scales::comma,
    breaks = seq(0, 12000, by = 2000)
  ) +
  theme_bw() +
  theme(
    legend.position = 'none',
    strip.text = element_text(face = 'bold', size = 10)
  ) +
  facet_wrap(~group, ncol = 4)
ggsave('results/pbmc_10k_v3/plots/ngene_over_numi.png', p, height = 9, width = 12)
To do
- Add correlation coefficient to plots where necessary.
- Try Cell Ranger 4.0.